The following graph shows the aggregate demand curve ( AD1) for this economy before the change in government spending. Use the green line (triangle symbol) to plot the new aggregate demand curve ( AD2) after the multiplier effect takes place. For simplicity, assume that there is no "crowding out." Hint: Be sure that the new aggregate demand curve (AD2) is parallel to the initial aggregate demand curve ( AD1 ). You can see the slope of AD1 by selecting it on the graph. 140 AD, 135 AD, 130 125 120 115 110 105 100 3 4 OUTPUT (Trillions of dollars) PRICE LEVEL 4. The multiplier effect of a change in government purchases Consider a hypothetical closed economy in which households spend $0.75 of each additional dollar they earn and save the remaining $0.25. and the spending multiplier for this economy is The marginal propensity to consume (MPC) for this economy is Suppose the government in this economy decides to increase government purchases by $250 billion. The increase in government purchases will lead . This increases income yet again, causing a to an increase in income, generating an initial change in consumption equal to second change in consumption equal to The total change in demand resulting from the initial change in government spending is The following graph shows the aggregate demand curve (AD1) for this economy before the change in government spending. Use the green line (triangle symbol) to plot the new aggregate demand curve ( AD2 ) after the multiplier effect takes place. For simplicity, assume that there is no "crowding out." Hint: Be sure that the new aggregate demand curve (AD2) is parallel to the initial aggregate demand curve (AD1 ). You can see the slope of AD1 by selecting it on the graph.
The following graph shows the aggregate demand curve ( AD1) for this economy before the change in government spending. Use the green line (triangle symbol) to plot the new aggregate demand curve ( AD2) after the multiplier effect takes place. For simplicity, assume that there is no "crowding out." Hint: Be sure that the new aggregate demand curve (AD2) is parallel to the initial aggregate demand curve ( AD1 ). You can see the slope of AD1 by selecting it on the graph. 140 AD, 135 AD, 130 125 120 115 110 105 100 3 4 OUTPUT (Trillions of dollars) PRICE LEVEL 4. The multiplier effect of a change in government purchases Consider a hypothetical closed economy in which households spend $0.75 of each additional dollar they earn and save the remaining $0.25. and the spending multiplier for this economy is The marginal propensity to consume (MPC) for this economy is Suppose the government in this economy decides to increase government purchases by $250 billion. The increase in government purchases will lead . This increases income yet again, causing a to an increase in income, generating an initial change in consumption equal to second change in consumption equal to The total change in demand resulting from the initial change in government spending is The following graph shows the aggregate demand curve (AD1) for this economy before the change in government spending. Use the green line (triangle symbol) to plot the new aggregate demand curve ( AD2 ) after the multiplier effect takes place. For simplicity, assume that there is no "crowding out." Hint: Be sure that the new aggregate demand curve (AD2) is parallel to the initial aggregate demand curve (AD1 ). You can see the slope of AD1 by selecting it on the graph.

Economics (MindTap Course List)
13th Edition
ISBN:9781337617383
Author:Roger A. Arnold
Publisher:Roger A. Arnold
Chapter18: Debates In Macroeconomics Over The Role And Effects Of Government
Section: Chapter Questions
Problem 3QP

Related questions
Question
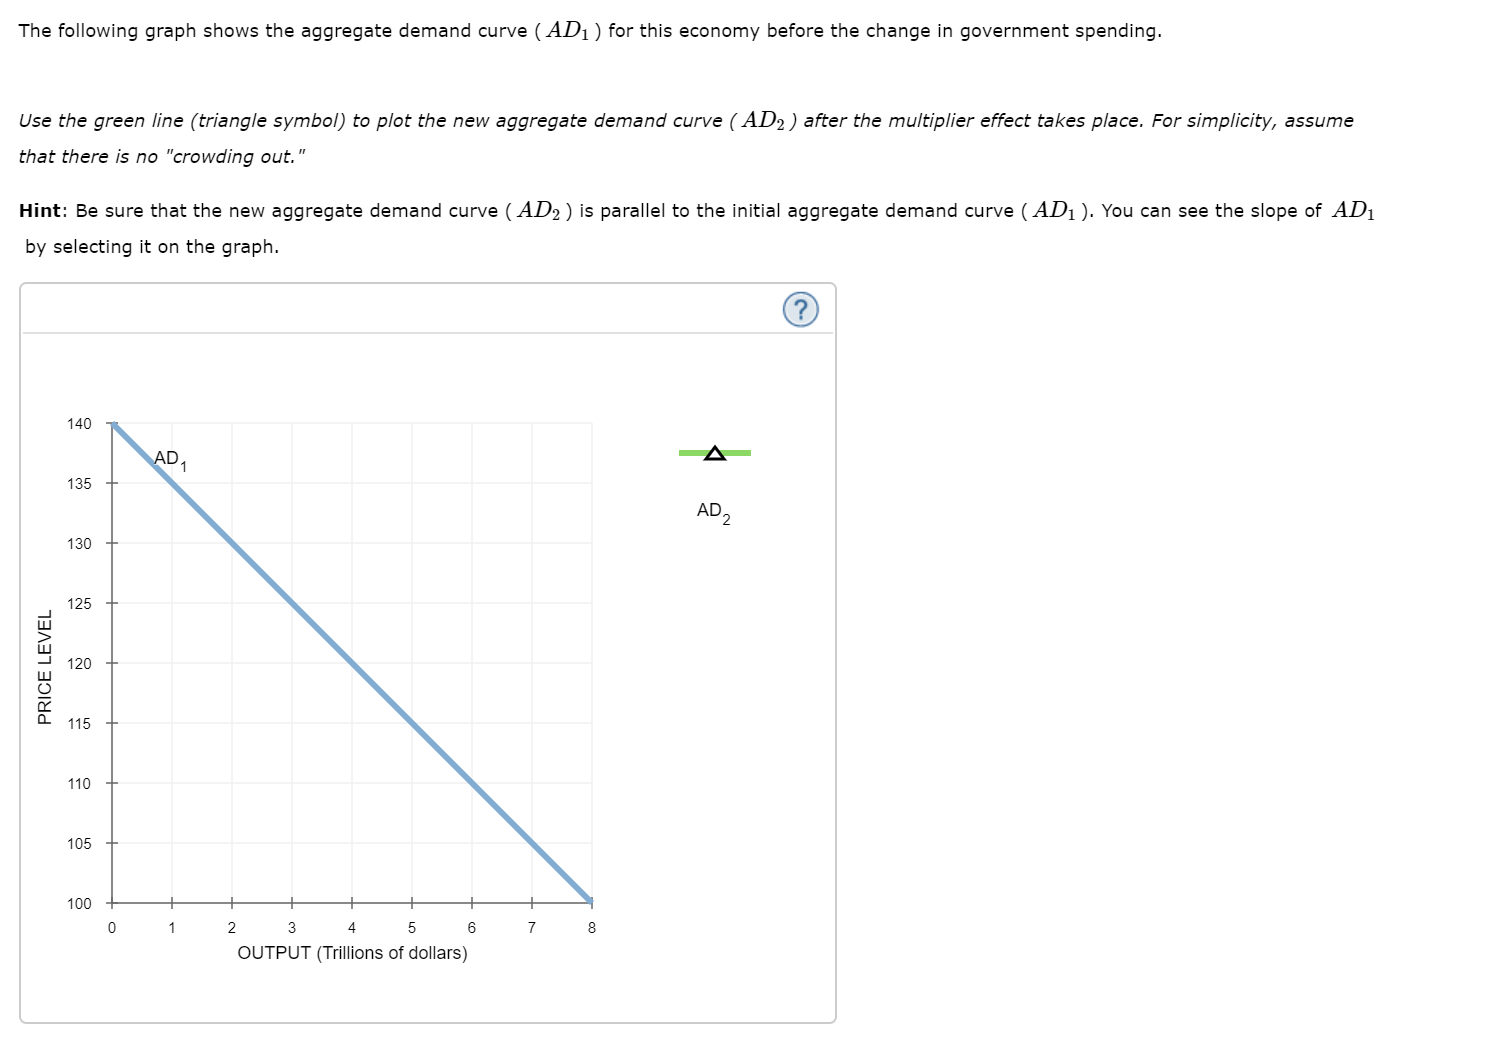
Transcribed Image Text:The following graph shows the aggregate demand curve ( AD1) for this economy before the change in government spending.
Use the green line (triangle symbol) to plot the new aggregate demand curve ( AD2) after the multiplier effect takes place. For simplicity, assume
that there is no "crowding out."
Hint: Be sure that the new aggregate demand curve (AD2) is parallel to the initial aggregate demand curve ( AD1 ). You can see the slope of AD1
by selecting it on the graph.
140
AD,
135
AD,
130
125
120
115
110
105
100
3
4
OUTPUT (Trillions of dollars)
PRICE LEVEL
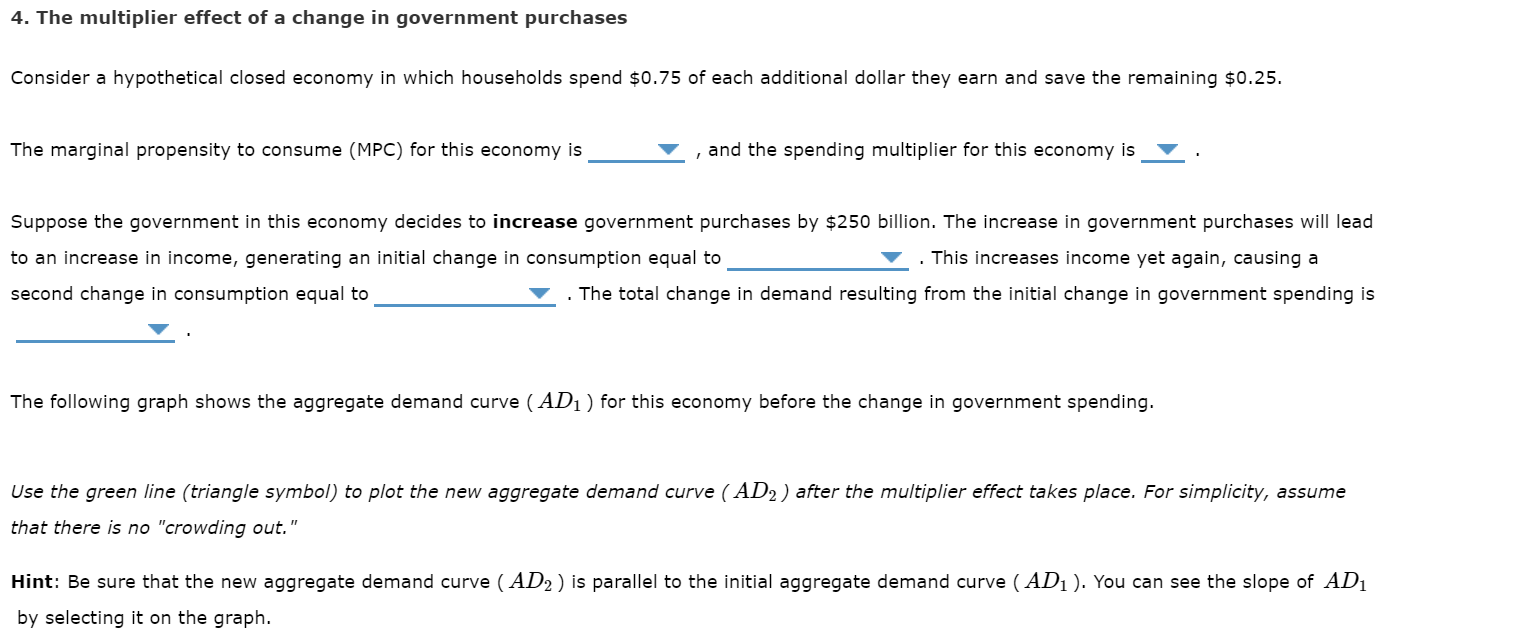
Transcribed Image Text:4. The multiplier effect of a change in government purchases
Consider a hypothetical closed economy in which households spend $0.75 of each additional dollar they earn and save the remaining $0.25.
and the spending multiplier for this economy is
The marginal propensity to consume (MPC) for this economy is
Suppose the government in this economy decides to increase government purchases by $250 billion. The increase in government purchases will lead
. This increases income yet again, causing a
to an increase in income, generating an initial change in consumption equal to
second change in consumption equal to
The total change in demand resulting from the initial change in government spending is
The following graph shows the aggregate demand curve (AD1) for this economy before the change in government spending.
Use the green line (triangle symbol) to plot the new aggregate demand curve ( AD2 ) after the multiplier effect takes place. For simplicity, assume
that there is no "crowding out."
Hint: Be sure that the new aggregate demand curve (AD2) is parallel to the initial aggregate demand curve (AD1 ). You can see the slope of AD1
by selecting it on the graph.
Expert Solution
This question has been solved!
Explore an expertly crafted, step-by-step solution for a thorough understanding of key concepts.

This is a popular solution!

Trending now
This is a popular solution!

Step by step
Solved in 2 steps with 3 images

Recommended textbooks for you
Economics (MindTap Course List)
Economics
ISBN:
9781337617383
Author:
Roger A. Arnold
Publisher:
Cengage Learning


Economics (MindTap Course List)
Economics
ISBN:
9781337617383
Author:
Roger A. Arnold
Publisher:
Cengage Learning


