The following graph shows the annual market for Michigan blueberries, which are sold in units of 50-pound boxes. Use the graph input tool to help you answer the following questions. You will not be graded on any changes you make to this graph Note: Once you enter a value in a white field, the graph and any corresponding amounts in each grey field will change accordingly. PRICE (Dollars per box) *RRRS Demand Graph Input Tool Market for Michigan Blueberries Price (Dollars per box) Quantity Demanded (Millions of boxes) 15 800 Quantity Supplied (Minions of boxes) 336
The following graph shows the annual market for Michigan blueberries, which are sold in units of 50-pound boxes. Use the graph input tool to help you answer the following questions. You will not be graded on any changes you make to this graph Note: Once you enter a value in a white field, the graph and any corresponding amounts in each grey field will change accordingly. PRICE (Dollars per box) *RRRS Demand Graph Input Tool Market for Michigan Blueberries Price (Dollars per box) Quantity Demanded (Millions of boxes) 15 800 Quantity Supplied (Minions of boxes) 336

Chapter17: Externalities And The Environment
Section: Chapter Questions
Problem 2.7P

Related questions
Question
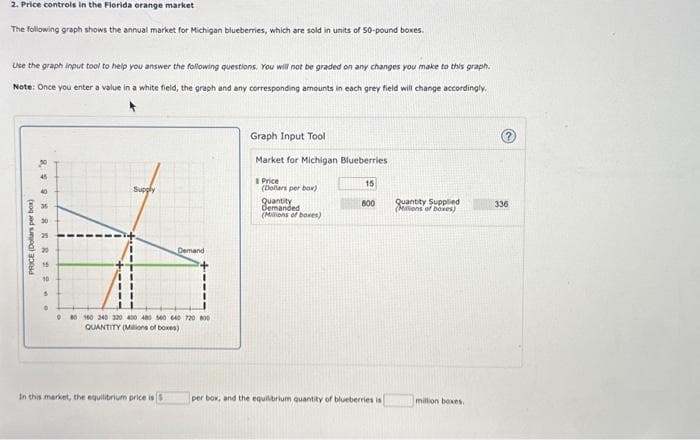
Transcribed Image Text:2. Price controls in the Florida orange market
The following graph shows the annual market for Michigan blueberries, which are sold in units of 50-pound boxes.
Use the graph input tool to help you answer the following questions. You will not be graded on any changes you make to this graph.
Note: Once you enter a value in a white field, the graph and any corresponding amounts in each grey field will change accordingly.
PRICE (Dollars per box)
29*RER 2
40
35
5
0
Supply
Demand
0 80 160 240 220 400 480 560 640 720 800
QUANTITY (Millions of boxes)
In this market, the equilibrium price is $
Graph Input Tool
Market for Michigan Blueberries.
Price
(Dollars per box)
Quantity
Demanded
(Millions of boxes)
15
800
per box, and the equilibrium quantity of blueberries is
Quantity Supplied
(Mions of boxes)
million boxes.
336
Transcribed Image Text:In this market, the equilibrium price is
per box, and the equilibrium quantity of blueberries is
Price
(Dollars per box)
15
35
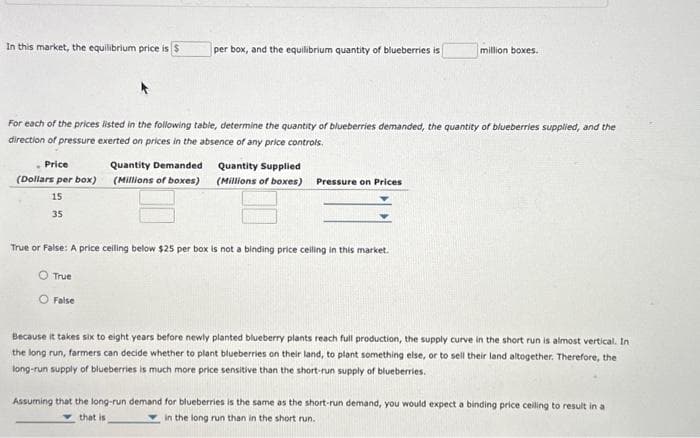
For each of the prices listed in the following table, determine the quantity of blueberries demanded, the quantity of blueberries supplied, and the
direction of pressure exerted on prices in the absence of any price controls.
Quantity Demanded
Quantity Supplied
(Millions of boxes) (Millions of boxes)
Pressure on Prices
million boxes.
True or False: A price ceiling below $25 per box is not a binding price celling in this market.
O True
O False
Because it takes six to eight years before newly planted blueberry plants reach full production, the supply curve in the short run is almost vertical. In
the long run, farmers can decide whether to plant blueberries on their land, to plant something else, or to sell their land altogether. Therefore, the
long-run supply of blueberries is much more price sensitive than the short-run supply of blueberries.
Assuming that the long-run demand for blueberries is the same as the short-run demand, you would expect a binding price celling to result in a
in the long run than in the short run.
that is
Expert Solution
This question has been solved!
Explore an expertly crafted, step-by-step solution for a thorough understanding of key concepts.

This is a popular solution!

Trending now
This is a popular solution!

Step by step
Solved in 5 steps

Knowledge Booster


Learn more about
Need a deep-dive on the concept behind this application? Look no further. Learn more about this topic, economics and related others by exploring similar questions and additional content below.Recommended textbooks for you

Principles of Microeconomics
Economics
ISBN:
9781305156050
Author:
N. Gregory Mankiw
Publisher:
Cengage Learning

Essentials of Economics (MindTap Course List)
Economics
ISBN:
9781337091992
Author:
N. Gregory Mankiw
Publisher:
Cengage Learning
Principles of Microeconomics
Economics
ISBN:
9781305156050
Author:
N. Gregory Mankiw
Publisher:
Cengage Learning
Essentials of Economics (MindTap Course List)
Economics
ISBN:
9781337091992
Author:
N. Gregory Mankiw
Publisher:
Cengage Learning

Principles of Economics 2e
Economics
ISBN:
9781947172364
Author:
Steven A. Greenlaw; David Shapiro
Publisher:
OpenStax

Brief Principles of Macroeconomics (MindTap Cours…
Economics
ISBN:
9781337091985
Author:
N. Gregory Mankiw
Publisher:
Cengage Learning