The following graph shows the daily demand curve for bikes in Chicago. Use the green rectangle (triangle symbols) to compute total revenue at various prices along the demand curve. Note: You will not be graded on any changes made to this graph.
The following graph shows the daily demand curve for bikes in Chicago. Use the green rectangle (triangle symbols) to compute total revenue at various prices along the demand curve. Note: You will not be graded on any changes made to this graph.

Principles of Economics 2e
2nd Edition
ISBN:9781947172364
Author:Steven A. Greenlaw; David Shapiro
Publisher:Steven A. Greenlaw; David Shapiro
Chapter5: Elasticity
Section: Chapter Questions
Problem 34P: The equation for a demand curve is P=2/Q. What is the elasticity of demand as price falls from 5 to...

Related questions
Question
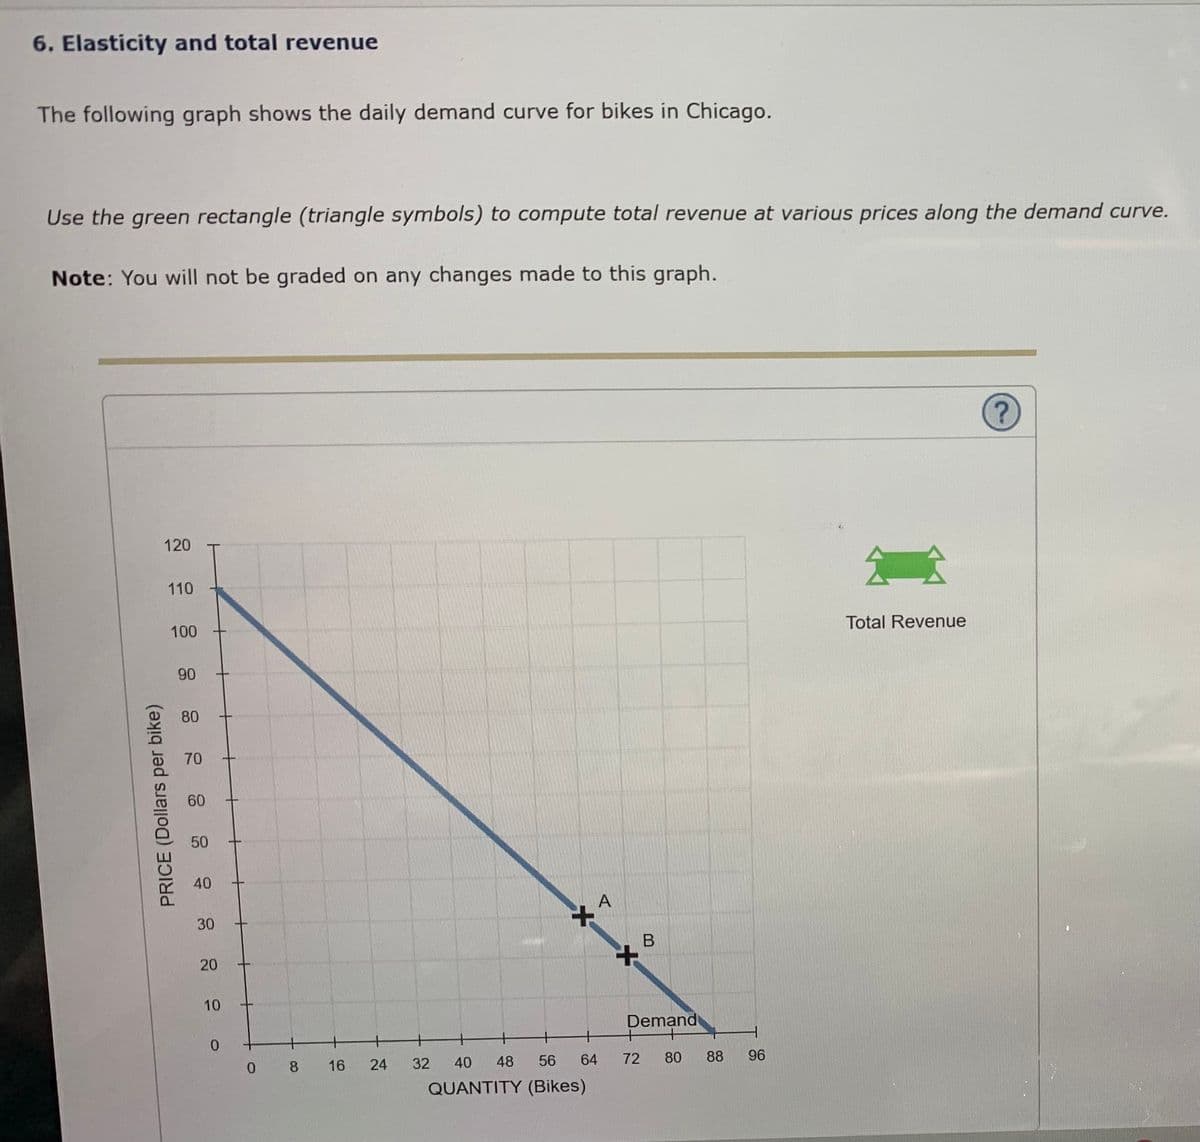
Transcribed Image Text:6. Elasticity and total revenue
The following graph shows the daily demand curve for bikes in Chicago.
Use the green rectangle (triangle symbols) to compute total revenue at various prices along the demand curve.
Note: You will not be graded on any changes made to this graph.
120
110
Total Revenue
100
90
80
70
60
40
A
30
20
10
Demand
16
24
32
40
48
56
64
72
80
88
96
QUANTITY (Bikes)
PRICE (Dollars per bike)
50
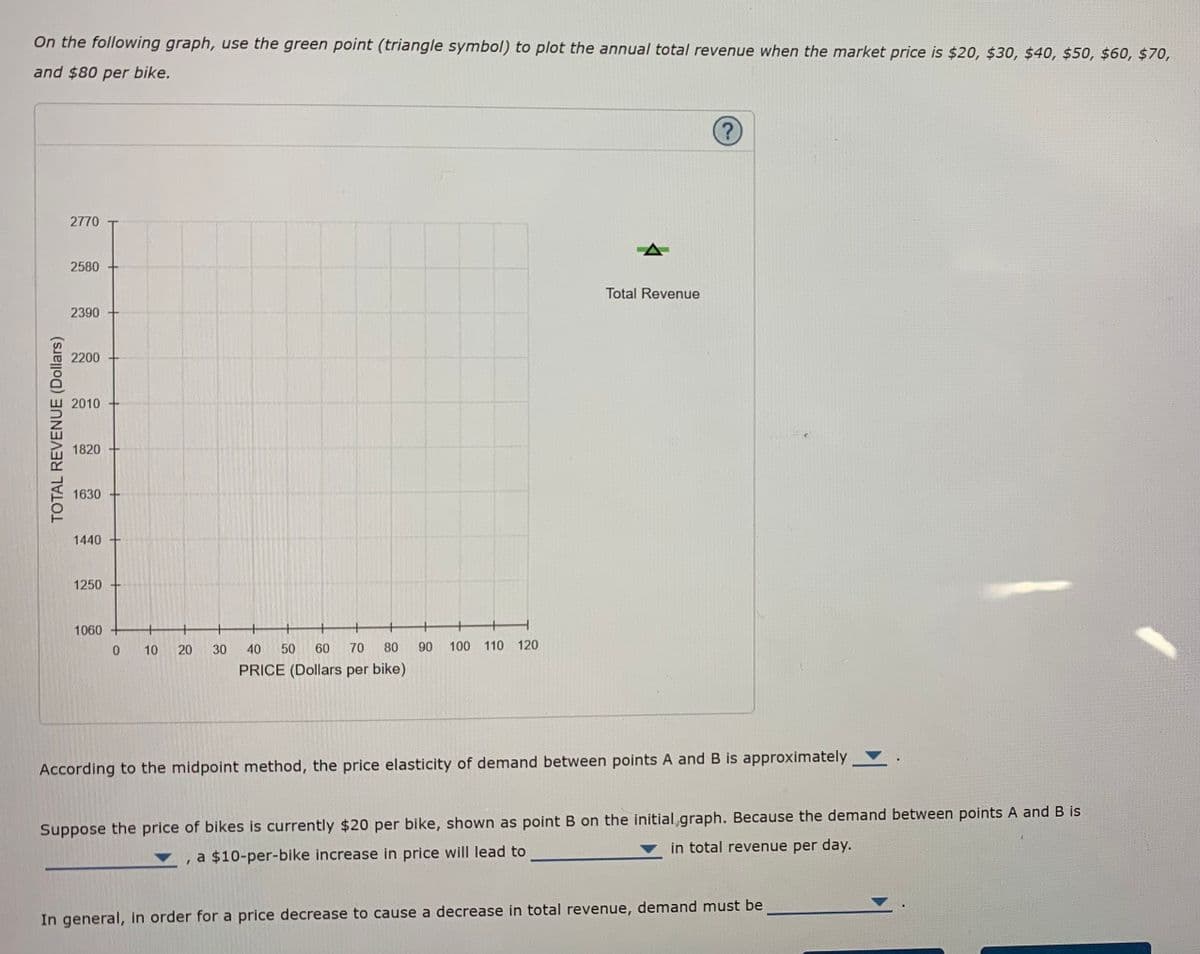
Transcribed Image Text:On the following graph, use the green point (triangle symbol) to plot the annual total revenue when the market price is $20, $30, $40, $50, $60, $70,
and $80 per bike.
2770
2580
Total Revenue
2390
2200
2010
1820
1630
1440
1250
1060
0.
10
30
40
50
60
70
80
90
100
110
120
PRICE (Dollars per bike)
According to the midpoint method, the price elasticity of demand between points A and B is approximately .
Suppose the price of bikes is currently $20 per bike, shown as point B on the initial graph. Because the demand between points A and B is
in total revenue per day.
a $10-per-bike increase in price will lead to
In general, in order for a price decrease to cause a decrease in total revenue, demand must be
TOTAL REVENUE (Dollars)
20
Expert Solution
This question has been solved!
Explore an expertly crafted, step-by-step solution for a thorough understanding of key concepts.

This is a popular solution!

Trending now
This is a popular solution!

Step by step
Solved in 2 steps with 1 images

Recommended textbooks for you
Principles of Economics 2e
Economics
ISBN:
9781947172364
Author:
Steven A. Greenlaw; David Shapiro
Publisher:
OpenStax

Essentials of Economics (MindTap Course List)
Economics
ISBN:
9781337091992
Author:
N. Gregory Mankiw
Publisher:
Cengage Learning

Principles of Economics 2e
Economics
ISBN:
9781947172364
Author:
Steven A. Greenlaw; David Shapiro
Publisher:
OpenStax
Essentials of Economics (MindTap Course List)
Economics
ISBN:
9781337091992
Author:
N. Gregory Mankiw
Publisher:
Cengage Learning

Principles of Microeconomics
Economics
ISBN:
9781305156050
Author:
N. Gregory Mankiw
Publisher:
Cengage Learning


Principles of Microeconomics (MindTap Course List)
Economics
ISBN:
9781305971493
Author:
N. Gregory Mankiw
Publisher:
Cengage Learning