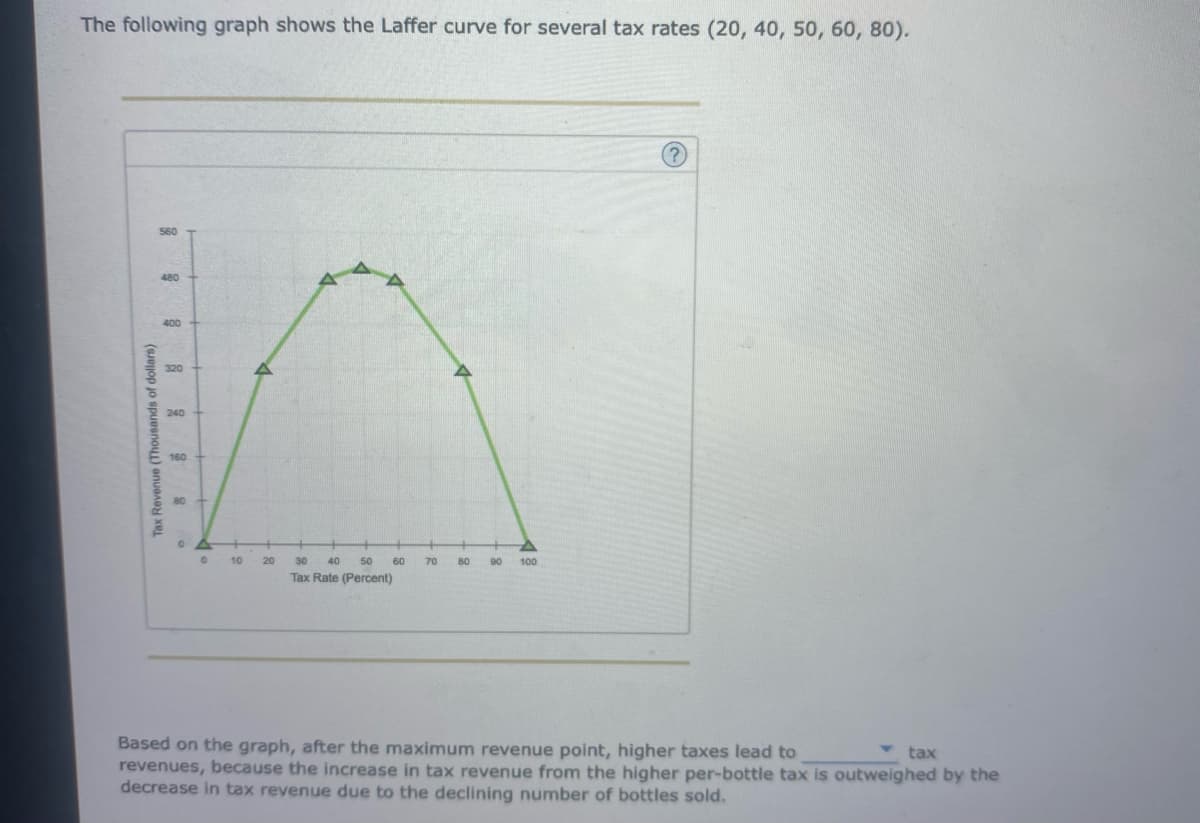
The following graph shows the Laffer curve for several tax rates (20, 40, 50, 60, 80). Tax Revenue (Thousands of dollars) 560 480 400 320 240 160 80 0 10 10 20 30 40 50 Tax Rate (Percent) 60 70 80 90 100 Based on the graph, after the maximum revenue point, higher taxes lead to tax revenues, because the increase in tax revenue from the higher per-bottle tax is outweighed by the decrease in tax revenue due to the declining number of bottles sold.
The following graph shows the Laffer curve for several tax rates (20, 40, 50, 60, 80). Tax Revenue (Thousands of dollars) 560 480 400 320 240 160 80 0 10 10 20 30 40 50 Tax Rate (Percent) 60 70 80 90 100 Based on the graph, after the maximum revenue point, higher taxes lead to tax revenues, because the increase in tax revenue from the higher per-bottle tax is outweighed by the decrease in tax revenue due to the declining number of bottles sold.

Principles of Economics 2e
2nd Edition
ISBN:9781947172364
Author:Steven A. Greenlaw; David Shapiro
Publisher:Steven A. Greenlaw; David Shapiro
Chapter3: Demand And Supply
Section: Chapter Questions
Problem 53P: Table 3.8 shows information on the demand and supply for bicycles, where the quantities of bicycles...

Related questions
Question
Confused and not sure how to answer
Transcribed Image Text:The following graph shows the Laffer curve for several tax rates (20, 40, 50, 60, 80).
Tax Revenue (Thousands of dollars)
560
480
400
320
240
160
80
0
0 10 20
30 40 50 60
Tax Rate (Percent)
70
80 90 100
Based on the graph, after the maximum revenue point, higher taxes lead to
revenues, because the increase in tax revenue from the higher per-bottle tax is outweighed by the
decrease in tax revenue due to the declining number of bottles sold.
tax
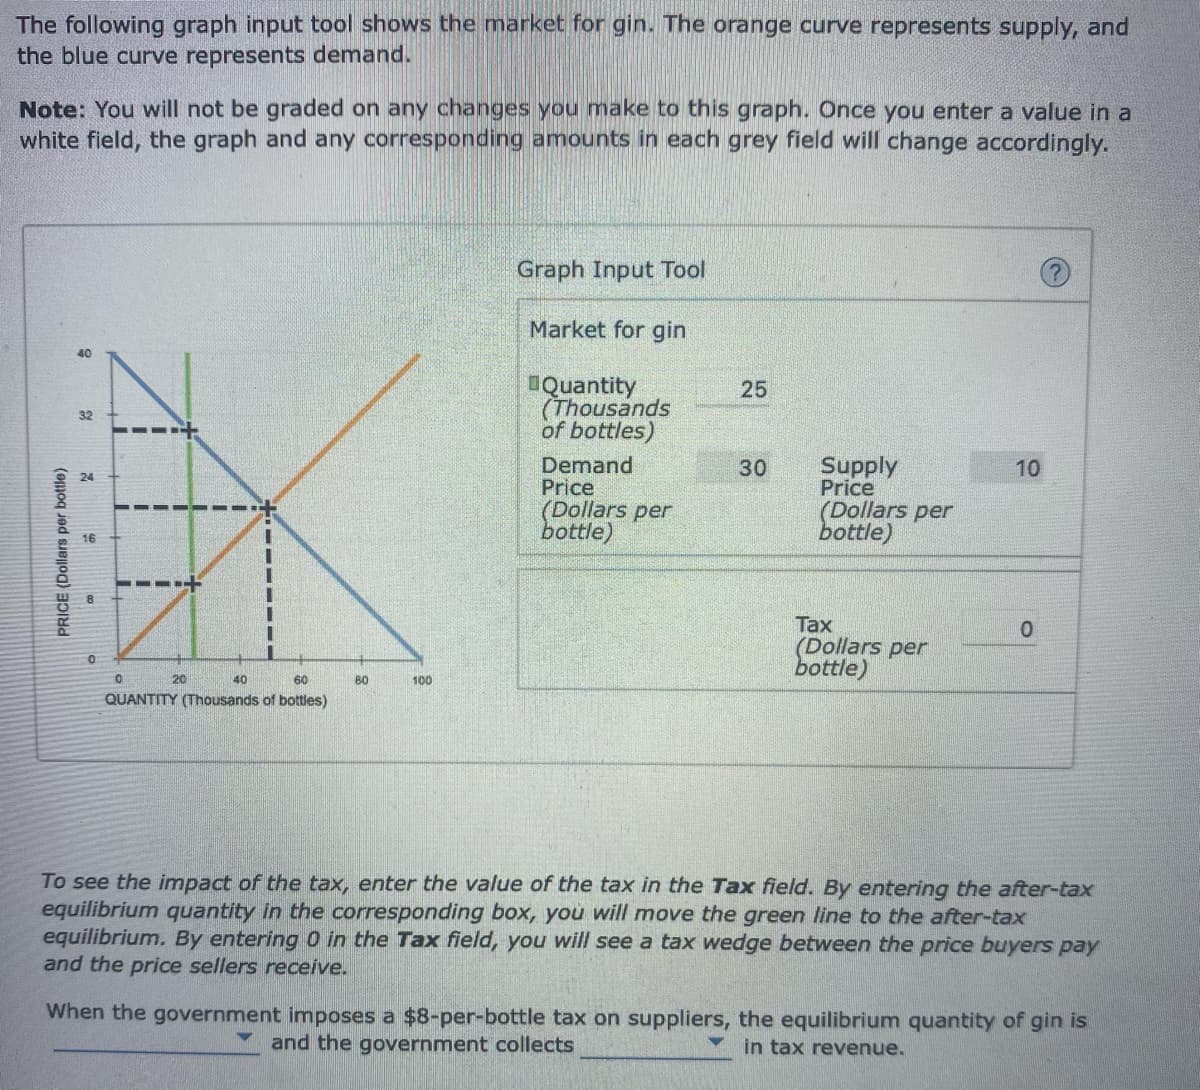
Transcribed Image Text:The following graph input tool shows the market for gin. The orange curve represents supply, and
the blue curve represents demand.
Note: You will not be graded on any changes you make to this graph. Once you enter a value in a
white field, the graph and any corresponding amounts in each grey field will change accordingly.
PRICE (Dollars per bottle)
40
32
07
16
00
0
TIIRT
0
55
11
40
60
QUANTITY (Thousands of bottles)
1
20
BO
100
Graph Input Tool
Market for gin
Quantity
(Thousands
of bottles)
Demand
Price
(Dollars per
bottle)
25
30
Supply
Price
(Dollars per
bottle)
Tax
(Dollars per
bottle)
10
0
To see the impact of the tax, enter the value of the tax in the Tax field. By entering the after-tax
equilibrium quantity in the corresponding box, you will move the green line to the after-tax
equilibrium. By entering 0 in the Tax field, you will see a tax wedge between the price buyers pay
and the price sellers receive.
When the government imposes a $8-per-bottle tax on suppliers, the equilibrium quantity of gin is
and the government collects
in tax revenue.
Expert Solution
This question has been solved!
Explore an expertly crafted, step-by-step solution for a thorough understanding of key concepts.

This is a popular solution!

Trending now
This is a popular solution!

Step by step
Solved in 4 steps with 1 images

Knowledge Booster


Learn more about
Need a deep-dive on the concept behind this application? Look no further. Learn more about this topic, economics and related others by exploring similar questions and additional content below.Recommended textbooks for you
Principles of Economics 2e
Economics
ISBN:
9781947172364
Author:
Steven A. Greenlaw; David Shapiro
Publisher:
OpenStax

Essentials of Economics (MindTap Course List)
Economics
ISBN:
9781337091992
Author:
N. Gregory Mankiw
Publisher:
Cengage Learning

Microeconomics: Principles & Policy
Economics
ISBN:
9781337794992
Author:
William J. Baumol, Alan S. Blinder, John L. Solow
Publisher:
Cengage Learning
Principles of Economics 2e
Economics
ISBN:
9781947172364
Author:
Steven A. Greenlaw; David Shapiro
Publisher:
OpenStax
Essentials of Economics (MindTap Course List)
Economics
ISBN:
9781337091992
Author:
N. Gregory Mankiw
Publisher:
Cengage Learning
Microeconomics: Principles & Policy
Economics
ISBN:
9781337794992
Author:
William J. Baumol, Alan S. Blinder, John L. Solow
Publisher:
Cengage Learning

Brief Principles of Macroeconomics (MindTap Cours…
Economics
ISBN:
9781337091985
Author:
N. Gregory Mankiw
Publisher:
Cengage Learning