
Economics (MindTap Course List)
13th Edition
ISBN:9781337617383
Author:Roger A. Arnold
Publisher:Roger A. Arnold
Chapter21: Production And Costs
Section21.5: Production And Costs In The Long Run
Problem 1ST

Related questions
Question
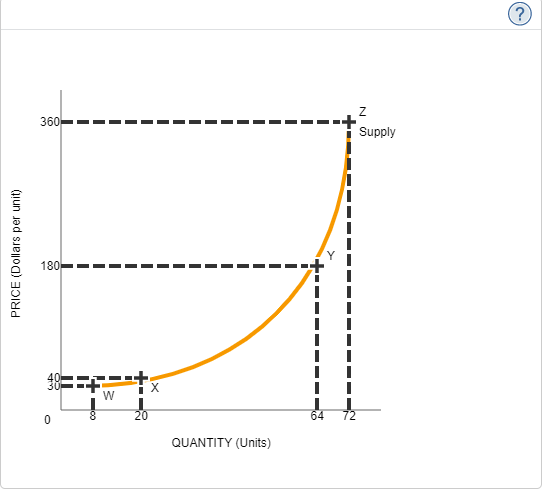
The following graph shows the supply of a good.
|
Region
|
Elastic
|
Inelastic
|
|
|---|---|---|---|
| Between W and X |
|
|
|
| Between Y and Z |
|
|
True or False: For high levels of quantity supplied where firms have reached near maximum capacity, supply becomes less elastic because firms may need to invest in additional capital in order to increase production further.
True
False
Transcribed Image Text:360
Supply
180
W
QUANTITY (Units)
N
Lioo
PRICE (Dollars per unit)
Expert Solution
This question has been solved!
Explore an expertly crafted, step-by-step solution for a thorough understanding of key concepts.

This is a popular solution!

Trending now
This is a popular solution!

Step by step
Solved in 2 steps

Knowledge Booster


Learn more about
Need a deep-dive on the concept behind this application? Look no further. Learn more about this topic, economics and related others by exploring similar questions and additional content below.Recommended textbooks for you
Economics (MindTap Course List)
Economics
ISBN:
9781337617383
Author:
Roger A. Arnold
Publisher:
Cengage Learning

Economics (MindTap Course List)
Economics
ISBN:
9781337617383
Author:
Roger A. Arnold
Publisher:
Cengage Learning