The following graph shows the yearly industrial output (measured in billions of zonars) of the city-state of Utarek on Mars over a 7-year period. Industrial output (Utarek) P(t) 6. 4 1 1 2 4 5 6. 7 Year since 2020 (a) In which year, to the nearest year, did the rate of change of yearly industrial output reach a maximum? (b) In which year, to the nearest year, did the rate of change of yearly industrial output reach a minimum? (c) In which year, to the nearest year, does the graph first change from concave down to concave up? What does the result tell you? O In that year, the rate of change of industrial output reached a maximum compared with nearby years. O In that year, the rate of change of industrial output reached a minimum compared with nearby years.
The following graph shows the yearly industrial output (measured in billions of zonars) of the city-state of Utarek on Mars over a 7-year period. Industrial output (Utarek) P(t) 6. 4 1 1 2 4 5 6. 7 Year since 2020 (a) In which year, to the nearest year, did the rate of change of yearly industrial output reach a maximum? (b) In which year, to the nearest year, did the rate of change of yearly industrial output reach a minimum? (c) In which year, to the nearest year, does the graph first change from concave down to concave up? What does the result tell you? O In that year, the rate of change of industrial output reached a maximum compared with nearby years. O In that year, the rate of change of industrial output reached a minimum compared with nearby years.

Chapter6: Exponential And Logarithmic Functions
Section6.7: Exponential And Logarithmic Models
Problem 16TI: Recent data suggests that, as of 2013, the rate of growth predicted by Moore’s Law no longer holds....

Related questions
Question
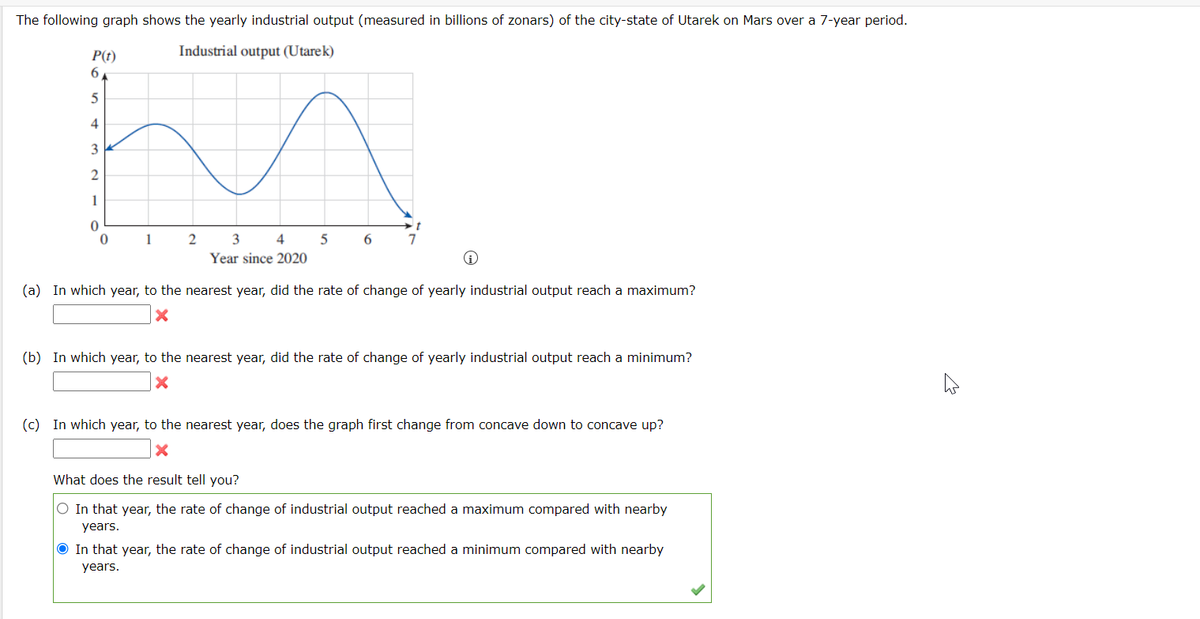
Transcribed Image Text:The following graph shows the yearly industrial output (measured in billions of zonars) of the city-state of Utarek on Mars over a 7-year period.
P(t)
Industrial output (Utarek)
4
3
1
1
3
4.
7
Year since 2020
(a) In which year, to the nearest year, did the rate of change of yearly industrial output reach a maximum?
(b) In which year, to the nearest year, did the rate of change of yearly industrial output reach a minimum?
(c) In which year, to the nearest year, does the graph first change from concave down to concave up?
What does the result tell you?
O In that year, the rate of change of industrial output reached a maximum compared with nearby
years.
O In that year, the rate of change of industrial output reached a minimum compared with nearby
years.
Expert Solution
This question has been solved!
Explore an expertly crafted, step-by-step solution for a thorough understanding of key concepts.

Step by step
Solved in 2 steps with 2 images

Recommended textbooks for you

Algebra & Trigonometry with Analytic Geometry
Algebra
ISBN:
9781133382119
Author:
Swokowski
Publisher:
Cengage
Algebra & Trigonometry with Analytic Geometry
Algebra
ISBN:
9781133382119
Author:
Swokowski
Publisher:
Cengage