The following histograms represent the heights, measured to the nearest cm, of 14 women and 13 men. Women's heights 3- 2- 1 150 155 160 165 170 175 180 185 190 Height (cm) Men's heights 2 1 0+ 150 155 160 165 170 175 180 185 190 Height (cm) Choose the two options from the list below that are true. Select one or more: Each of the intervals with the lowest frequency in the women's heights dataset contains a smaller number of data values than one of the intervals with the lowest frequency in the men's heights dataset. The histograms are divided into six intervals for the women's heights dataset and eight for the men's heights dataset. The histogram of the women's heights dataset has a greater number of intervals containing two values than the histogram of the men's heights dataset. Both histograms are right-skewed. O The range of the women's heights dataset is greater than the range of the men's heights dataset. Aouan ba Aouan ba
The following histograms represent the heights, measured to the nearest cm, of 14 women and 13 men. Women's heights 3- 2- 1 150 155 160 165 170 175 180 185 190 Height (cm) Men's heights 2 1 0+ 150 155 160 165 170 175 180 185 190 Height (cm) Choose the two options from the list below that are true. Select one or more: Each of the intervals with the lowest frequency in the women's heights dataset contains a smaller number of data values than one of the intervals with the lowest frequency in the men's heights dataset. The histograms are divided into six intervals for the women's heights dataset and eight for the men's heights dataset. The histogram of the women's heights dataset has a greater number of intervals containing two values than the histogram of the men's heights dataset. Both histograms are right-skewed. O The range of the women's heights dataset is greater than the range of the men's heights dataset. Aouan ba Aouan ba

Glencoe Algebra 1, Student Edition, 9780079039897, 0079039898, 2018
18th Edition
ISBN:9780079039897
Author:Carter
Publisher:Carter
Chapter10: Statistics
Section10.2: Representing Data
Problem 24PFA

Related questions
Question
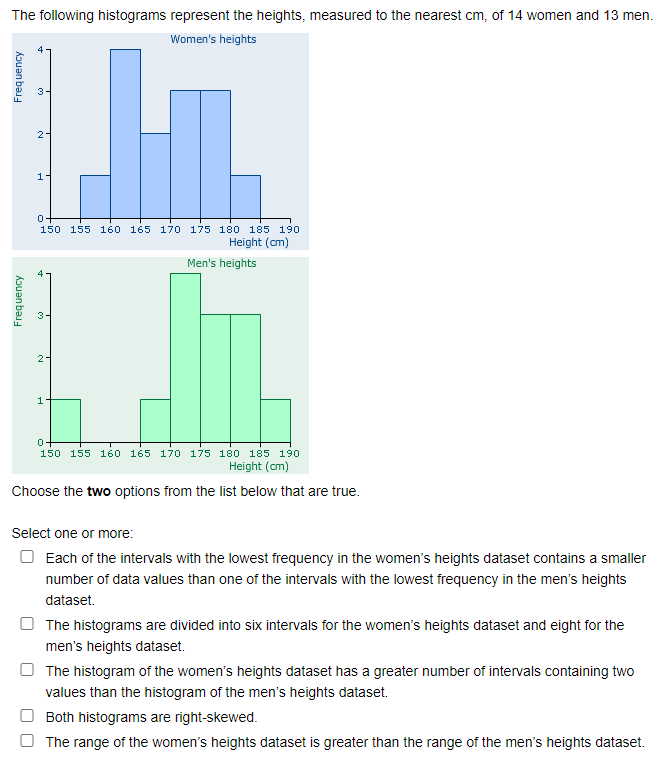
Transcribed Image Text:The following histograms represent the heights, measured to the nearest cm, of 14 women and 13 men.
Women's heights
3-
2-
1
150 155 160 165 170 175 180 185 190
Height (cm)
Men's heights
2
1
0+
150 155 160 165 170 175 180 185 190
Height (cm)
Choose the two options from the list below that are true.
Select one or more:
Each of the intervals with the lowest frequency in the women's heights dataset contains a smaller
number of data values than one of the intervals with the lowest frequency in the men's heights
dataset.
The histograms are divided into six intervals for the women's heights dataset and eight for the
men's heights dataset.
The histogram of the women's heights dataset has a greater number of intervals containing two
values than the histogram of the men's heights dataset.
Both histograms are right-skewed.
O The range of the women's heights dataset is greater than the range of the men's heights dataset.
Aouan ba
Aouan ba
Expert Solution
This question has been solved!
Explore an expertly crafted, step-by-step solution for a thorough understanding of key concepts.

Step by step
Solved in 2 steps with 1 images

Recommended textbooks for you
Glencoe Algebra 1, Student Edition, 9780079039897…
Algebra
ISBN:
9780079039897
Author:
Carter
Publisher:
McGraw Hill
Glencoe Algebra 1, Student Edition, 9780079039897…
Algebra
ISBN:
9780079039897
Author:
Carter
Publisher:
McGraw Hill