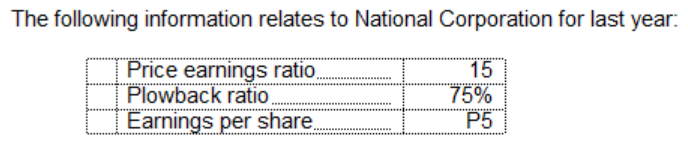
The following information relates to National Corporation for last year: Price earnings ratio Plowback ratio, Earnings per share 15 75% P5


Q: The income statement, statement of retained earnings, and balance sheet for Somerville Company are…
A: Introduction: Return on sales : Division of Net sales with Net income derives the Return on sales.
Q: Earnings per Share, Price-Earnings Ratio, Dividend Yield The following information was taken from…
A: Number of common shares outstanding = $1,950,000/$15 Number of common shares outstanding = 130,000…
Q: Horizontal analysis of income statement For 20Y2, Macklin Inc. reported a significant increase in…
A: Horizontal Analysis of Income statement shows increase or decrease in values as compared to last…
Q: Earnings per Share, Price-Earnings Ratio, Dividend Yield The following information was taken from…
A: a.Compute earnings per share on the common stock.
Q: Franklin Co. reported the following year-end data: net income of $220,000; annual cash dividends per…
A: Financial ratio analysis: It can be defined as an analysis tool that is based upon the relative…
Q: Calculate profitability measures The following information was available for the year ended December…
A: Margin: Margin means the percentage of profit in the sales, it can be calculated by dividing net…
Q: a. Determine the return on total assets, the return on stockholders' equity, and the return on…
A: Ratio analysis :— Relationship Between two no. Of the same kind. The ratio analysis is one the most…
Q: ABC's Net Income this year was $22,973,000 and there were 19.9 million shares outstanding. If the…
A: formula for PE RATIO: PE ratio=share priceearning per share Formula for Earning per share: earning…
Q: Pecunious Products, Incorporated’s financial results for the past three years are summarized below:…
A: Let EPS in year n be EPSn. Let price in year n be Pn. Dividends paid in all years (D) = $1.50…
Q: Horizontal Analysis of the Income Statement Income statement data for Boone Company for two recent…
A: The horizontal analysis involves comparing the current year amounts to the previous year amounts and…
Q: Prepare a comparative income statement with horizontal analysis, indicating the increase (decrease)…
A: Horizontal analysis: The comparison of an item of a financial statement of one year against the…
Q: Notes: a. The firm has an 8-year financial lease requiring annual beginning-of-year payments of…
A: Vertical analysis : Under this system, each item in the financial statement is shown in the…
Q: Pecunious Products, Incorporated’s financial results for the past three years are summarized below:…
A: Inventory turnover is an economic statistic that shows how many times a firm's inventory is sold and…
Q: Here is the income statement for Sandhill, Inc. Net sales Cost of goods sold Gross profit Expenses…
A: Ratio analysis helps to analyze the financial statements of the company. The management can take…
Q: Assume the following sales data for a company: Year 2 $562,500 Year 1 $450,000 What is the…
A: SOLUTION- FORMULA= PERCENTAGE INCREASE IN SALES FROM YEAR 1 TO YEAR 2= CHANGE IN SALES FROM YEAR 1…
Q: National Company's net income last year was P75,000. The company paid preferred dividends of P12,000…
A: Return on common stockholders equity means net earnings earned on the investment made by common…
Q: The income statements for Finac Company for the two years are as follows: Year 2 Year 1 Sales…
A: Common size income statements means where sale is taken as 100 percent of every year and all other…
Q: [EXCEL] Market-value ratios: Rockwell Jewelers management announced that the company had net…
A: Earning per share can be calculated as:
Q: Case 1 Given the following financial statements historical ratios, and industry averages, calculate…
A: The question is related to Ratio Analysis. The return on Asset will be calculated with the help of…
Q: What's the company's profit margin?
A: Profit Margin: This ratio tells the measurement of the business profitability. It is computed by…
Q: Earnings per Share, Price-Earnings Ratio, Dividend Yield The following information was taken from…
A: Formulas:
Q: Earnings per Share, Price-Earnings Ratio, Dividend Yield The following information was taken from…
A: Earnings per share: Earnings per share represent the amount of income earned per share of…
Q: Horizontal Analysis of the Income Statement Income statement data for Winthrop Company for two…
A: Current Year Previous Year Difference Sales $537,600 $420,000 17600 Cost of goods…
Q: b.) From the given figures relating to the following profitability ratios for the two years: Wick…
A: The ration analysis helps to analyze the financial statements of the business. The gross profit and…
Q: Horizontal Analysis of the Income Statement Income statement data for Winthrop Company for two…
A: Horizontal analysis refers to the measurement of the percentage change in the comparative financial…
Q: Assume the following sales data for a company: Current year$832,402 Preceding year608,082 What is…
A: The % increase in sales is calculated as increase in sales in current year divided by previous year…
Q: Case 1 Given the following financial statements historical ratios, and industry averages, calculate…
A: The question is related to Ratio Analysis. The Inventory Turnover Ratio is calculated with the help…
Q: The following information was available for the year ended December 31, 2019: Sales $600,000 85,600…
A: Solution a i) Margin ratio = net income/ sales*100 =$85600 / 600,000*100 = 14.27% ii). Assets…
Q: A company’s sales in the prior year were $300,000 and in the current year were $351,000. Using the…
A: Horizontal analysis is prepared to calculate the variance from previous year by showing…
Q: I need to determine the following measures for 20Y2 for numbers 11-13 (Determine the following…
A: Asset turnover = Sales / Average Total assets where, Average Total assets = (Beginning Total assets…
Q: National Co. had P24,000,000 in sales last year. The company's net income was P500,000, its total…
A: The ratio analysis helps to analyse the financial statements of the business with assets and…
Q: Calculate profitability measures The following information was available for the year ended December…
A: Hi student Since there are multiple sub parts, we will answer only first three sub parts.
Q: Plano Corporation reported net income P24,000; net sales P400,000; and average assets P600,000 for…
A: Given that: Net Income = P24000 Net Sales = P400,000
Q: Market Value Ratios Wilsons, Inc., has a current stock price of $64. For the past year, the company…
A: Earnings per share of the company is the net income dividend by the no. of shares that are…
Q: Your boss has asked you to review these results and then answer the following questions: Is it…
A: “Since you have posted a question with multiple sub-parts, we will solve the first three sub-parts…
Q: The following annual data pertains to National Co.: Financial breakeven point 519,000 Preferred…
A: The financial breakeven point is a measure for finding out the financial health of the company. It…
Q: Selected current year company information follows: Net income Net sales Total liabilities,…
A: Correct option is D. 6.28% Return on Asset's (ROA) : = Earning after tax / Total assets × 100
Q: QUESTION: I need to determine the following measures for 20Y2 for numbers 16-18 (Determine the…
A: Ratio analysis: This is the quantitative analysis of financial statements of a business enterprise.…
Q: A company reports earnings per share on common stock of $2.00 when the market price of per share of…
A: Price Earnings Ratio: It is an accounting ratio of a company that establish the relationship between…
Q: Earnings per Share, Price-Earnings Ratio, Dividend Yield The following information was taken from…
A: EPS = Profits attributable to common shareholders/ Weighted outstanding shares Profits…
Q: 1. Calculate the following ratios for each year (Round ratios and percentages to one decimal place,…
A: 1. Return on total assets = (Operating income/ Average total assets) x 100 2. Return on…
Q: Pecunious Products, Incorporated’s financial results for the past three years are summarized below:…
A: “Since you have posted a question with multiple sub-parts, we will solve the first three sub-parts…
Q: epare a comparative income statement with horizontal analysis, indicating the increase (decrease)…
A:
Q: Horizontal Analysis of Income StatementFor 20Y2, Macklin Inc. reported a significant increase in net…
A: 1. Prepare a comparative income statement by horizontal analysis for two-year period as shown below:…
Q: Example 5: A firm sold goods worth 75,00,000 and its gross profit is 20 per cent of sales value. The…
A: Ratio analysis means where different ratio of various years of years companies has been compared and…
What is National's dividend yield ratio for last year?

Step by step
Solved in 2 steps


- Earnings per share Financial statement data for the years 20Y5 and 20Y6 for Black Bull Inc. follow: a. Determine the earnings per share for 20Y5 and 20Y6. b. Is the change in the earnings per share from 20Y5 to 20Y6 favorable or unfavorable?Rebert Inc. showed the following balances for last year: Reberts net income for last year was 3,182,000. Refer to the information for Rebert Inc. above. Also, assume that the market price per share for Rebert is 51.50. Required: 1. Compute the dollar amount of preferred dividends. 2. Compute the number of common shares. 3. Compute earnings per share. (Note: Round to two decimals.) 4. Compute the price-earnings ratio. (Note: Round to the nearest whole number.)Measures of liquidity, solvency, and profitability The comparative financial statements of Marshall Inc. are as follows. The market price of Marshall common stock was 82.60 on December 31, 20Y2. Instructions Determine the following measures for 20Y2 (round to one decimal place, including percentages, except for per-share amounts): 1. Working capital 2. Current ratio 3. Quick ratio 4. Accounts receivable turnover 5. Number of days sales in receivables 6. Inventory turnover 7. Number of days sales in inventory 8. Ratio of fixed assets to long-term liabilities 9. Ratio of liabilities to stockholders equity 10. Times interest earned 11. Asset turnover 12. Return on total assets 13. Return on stockholders equity 14. Return on common stockholders equity 15. Earnings per share on common stock 16. Price-earnings ratio 17. Dividends per share of common stock 18. Dividend yield
- Rebert Inc. showed the following balances for last year: Reberts net income for last year was 3,182,000. Refer to the information for Rebert Inc. above. Also, assume that the dividends paid to common stockholders for last year were 2,600,000 and that the market price per share of common stock is 51.50. Required: 1. Compute the dividends per share. 2. Compute the dividend yield. (Note: Round to two decimal places.) 3. Compute the dividend payout ratio. (Note: Round to two decimal places.)The income statement, statement of retained earnings, and balance sheet for Somerville Company are as follows: Includes both state and federal taxes. Refer to the information for Somerville Company on the previous pages. Also, assume that the price per common share for Somerville is 8.10. Required: Compute the price-earnings ratio. (Note: Round the answer to two decimal places.)Measures of liquidity, solvency, and profitability The comparative financial statements of Marshall Inc. are as follows. The market price of Marshall common stock was 82.60 on December 31, 20Y2. Instructions Determine the following measures for 20Y2, rounding to one decimal place, including percentages, except for per-share amounts: 1. Working capital 2. Current ratio 3. Quick ratio 4. Accounts receivable turnover 5. Number of days sales in receivables 6. Inventory turnover 7. Number of days sales in inventory 8. Ratio of fixed assets to long-term liabilities 9. Ratio of liabilities to stockholders equity 10. Times interest earned 11. Asset turnover 12. Return on total assets 13. Return on stockholders equity 14. Return on common stockholders equity 15. Earnings per share on common stock 16. Price-earnings ratio 17. Dividends per share of common stock 18. Dividend yield
- Juroe Company provided the following income statement for last year: Juroes balance sheet as of December 31 last year showed total liabilities of 10,250,000, total equity of 6,150,000, and total assets of 16,400,000. Required: 1. Calculate the return on sales. (Note: Round the percent to two decimal places.) 2. CONCEPTUAL CONNECTION Briefly explain the meaning of the return on sales ratio, and comment on whether Juroes return on sales ratio appears appropriate.Five measures of solvency or profitability The balance sheet for Garcon Inc. at the end of the current fiscal year indicated the following: Income before income tax was 3,000,000, and income taxes were 1,200,000 for the current year. Cash dividends paid on common stock during the current year totaled 1,200,000. The common stock was selling for 32 per share at the end of the year. Determine each of the following: (a) times interest earned ratio, (b) earnings per share on common stock, (c) price-earnings ratio, (d) dividends per share of common stock, and (e) dividend yield. Round ratios and percentages to one decimal place, except for per-share amounts.Profitability metrics The following selected data were taken from the financial statements of The O'Malley Group Inc. for December 31, 20Y5. 20Y4. and 20Y3: No dividends on common stock were declared between 20Y3 and 20Y5. a.Determine the return on total assets, the return on stockholders' equity, and the return on common stockholders' equity Tor the years 20Y4 and 20Y5. Round to one decimal place. b. What conclusions can be drawn from these data as to the company's profitability?
- Twenty metrics of liquidity, solvency, and profitability The comparative financial statements of Automotive Solutions Inc. are as follows. The market price of Automotive Solutions Inc. common stock was $119.70 on December 31, 20Y8 Instructions Earnings per share on common stockRebert Inc. showed the following balances for last year: Reberts net income for last year was 3,182,000. Refer to the information for Rebert Inc. above. Required: 1. Calculate the average common stockholders equity. 2. Calculate the return on stockholders equity.Cuneo Companys income statements for the last 3 years are as follows: Refer to the information for Cuneo Company above. Required: 1. Prepare a common-size income statement for Year 2 by expressing each line item for Year 2 as a percentage of that same line item from Year 1. (Note: Round percentages to the nearest tenth of a percent.) 2. Prepare a common-size income statement for Year 3 by expressing each line item for Year 3 as a percentage of that same line item from Year 1. (Note: Round percentages to the nearest tenth of a percent.)


