Case 1 Given the following financial statements historical ratios, and industry averages, calculate Sterling Company's financial ratios for the most recent year. (Assume a 365-day year.) Sterling Company Income Statement for the Year Ended December 31, 2012 $ 10,000,000 7,500,000 Sales revenue Less: Cost of Goods Sold Gross Profits 2,500,000 Less: Operating expenses Selling expense General and administrative expens 300,000 650,000 Lease expense 50,000 Depreciation expense Total operating expense 200,000 1,200,000 Operating profits 1,300,000 Less: Interest expense 200,000 Net profit before taxes 1100,000 Less Taxes (rate - 40%) 440.000 Net profit after taxes Less: Preferred stock dividends 660,000 50,000 Earnings available for common stockholders 610,000 Earnings per share Sterling Company Balance Sheet as of December 31, 2012 Assets Liabilities & Stockholders' Equtiy Cash 200,000 Accounts payable Notes payable 900,000 Marketable Securities 50,000 200,000 Accounts receivable 800,000 Accruals 100,000 Inventories 950,000 Total current liabilities 1.200,000 Total current assets 2.000.000 Long-term debt (include financial leases) Total liabilities 3,000,000 12,000,000 Gross fixed assets (at cost) Less: Accumulated depreciation 4,200,000 3,000,000 Preferred stock (25,000 shares, $2 dividend) 1,000,000 Net fixed assets 9.000.000 Common stiock (200,000 shares at $3 par) 600,000 Paid-in capital in excess of par value-common Retained earrings Other assets 1,000,000 5,200,000 Total assets 12,000,000 1,000,000 Total stockholders' equity Total liabilities & stockholders' equity 7,800,000 12,000,000
Case 1 Given the following financial statements historical ratios, and industry averages, calculate Sterling Company's financial ratios for the most recent year. (Assume a 365-day year.) Sterling Company Income Statement for the Year Ended December 31, 2012 $ 10,000,000 7,500,000 Sales revenue Less: Cost of Goods Sold Gross Profits 2,500,000 Less: Operating expenses Selling expense General and administrative expens 300,000 650,000 Lease expense 50,000 Depreciation expense Total operating expense 200,000 1,200,000 Operating profits 1,300,000 Less: Interest expense 200,000 Net profit before taxes 1100,000 Less Taxes (rate - 40%) 440.000 Net profit after taxes Less: Preferred stock dividends 660,000 50,000 Earnings available for common stockholders 610,000 Earnings per share Sterling Company Balance Sheet as of December 31, 2012 Assets Liabilities & Stockholders' Equtiy Cash 200,000 Accounts payable Notes payable 900,000 Marketable Securities 50,000 200,000 Accounts receivable 800,000 Accruals 100,000 Inventories 950,000 Total current liabilities 1.200,000 Total current assets 2.000.000 Long-term debt (include financial leases) Total liabilities 3,000,000 12,000,000 Gross fixed assets (at cost) Less: Accumulated depreciation 4,200,000 3,000,000 Preferred stock (25,000 shares, $2 dividend) 1,000,000 Net fixed assets 9.000.000 Common stiock (200,000 shares at $3 par) 600,000 Paid-in capital in excess of par value-common Retained earrings Other assets 1,000,000 5,200,000 Total assets 12,000,000 1,000,000 Total stockholders' equity Total liabilities & stockholders' equity 7,800,000 12,000,000

Corporate Financial Accounting
14th Edition
ISBN:9781305653535
Author:Carl Warren, James M. Reeve, Jonathan Duchac
Publisher:Carl Warren, James M. Reeve, Jonathan Duchac
Chapter14: Financial Statement Analysis
Section: Chapter Questions
Problem 14.1EX: Vertical analysis of income statement Revenue and expense data for Innovation Quarter Inc. for two...

Related questions
Question
Notes:
a. The firm has an 8-year financial lease requiring annual beginning-of-year payments of $50,000. Five years of the lease have yet to run.
b. Annual credit purchases of $6,200,000 were made during the year.
c. The annual principal payment on the long-term debt is $100,000.
d. On December 31, 2012, the firm’s common stock closed at $39.50 per share.
Question:
1. What is the
2. What is the
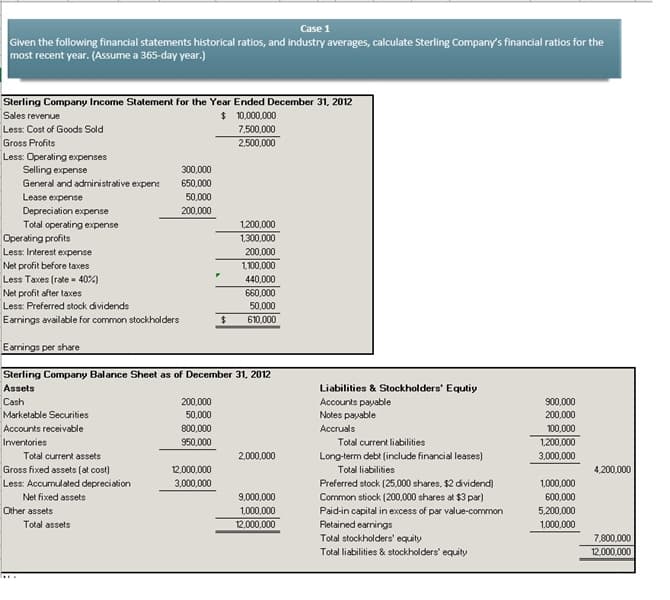
Transcribed Image Text:Case 1
Given the following financial statements historical ratios, and industry averages, calculate Sterling Company's financial ratios for the
most recent year. (Assume a 365-day year.)
Sterling Company Income Statement for the Year Ended December 31, 2012
$ 10,000,000
7,500,000
Sales revenue
Less: Cost of Goods Sold
Gross Profits
2,500,000
Less: Operating expenses
Selling expense
General and administrative expens
300,000
650,000
Lease expense
50,000
Depreciation expense
Total operating expense
200,000
1,200,000
Operating profits
1,300,000
200,000
Less: Interest expense
Net profit before taxes
1,100,000
Less Taxes (rate - 40%)
440,000
Net profit after taxes
Less: Preferred stock dividends
660,000
50,000
Earnings available for common stockholders
24
610,000
Earnings per share
Sterling Company Balance Sheet as of December 31, 2012
Assets
Liabilities & Stockholders' Equtiy
Cash
200,000
Accounts payable
Notes payable
900,000
Marketable Securities
50,000
200,000
Accounts receivable
800,000
Accruals
100,000
Inventories
950,000
Total current liabilities
1,200,000
Total current assets
2.000,000
Long-term debt (include financial leases)
Total liabilities
3,000,000
Gross fixed assets (at cost)
12,000,000
4,200,000
Less: Accumulated depreciation
3,000,000
Preferred stock (25,000 shares, $2 dividend)
1,000,000
Net fixed assets
9,000,000
Common stiock (200,000 shares at $3 par)
Paid-in capital in excess of par value-common
600,000
Other assets
1,000,000
5,200,000
Total assets
12,000,000
Retained earrings
Total stockholders' equity
Total liabilities & stockholders' equity
1,000,000
7,800,000
12,000,000
Expert Solution
This question has been solved!
Explore an expertly crafted, step-by-step solution for a thorough understanding of key concepts.

This is a popular solution!

Trending now
This is a popular solution!

Step by step
Solved in 2 steps

Recommended textbooks for you
Corporate Financial Accounting
Accounting
ISBN:
9781305653535
Author:
Carl Warren, James M. Reeve, Jonathan Duchac
Publisher:
Cengage Learning

Managerial Accounting
Accounting
ISBN:
9781337912020
Author:
Carl Warren, Ph.d. Cma William B. Tayler
Publisher:
South-Western College Pub

Financial Accounting
Accounting
ISBN:
9781305088436
Author:
Carl Warren, Jim Reeve, Jonathan Duchac
Publisher:
Cengage Learning
Corporate Financial Accounting
Accounting
ISBN:
9781305653535
Author:
Carl Warren, James M. Reeve, Jonathan Duchac
Publisher:
Cengage Learning
Managerial Accounting
Accounting
ISBN:
9781337912020
Author:
Carl Warren, Ph.d. Cma William B. Tayler
Publisher:
South-Western College Pub
Financial Accounting
Accounting
ISBN:
9781305088436
Author:
Carl Warren, Jim Reeve, Jonathan Duchac
Publisher:
Cengage Learning

Financial Accounting
Accounting
ISBN:
9781337272124
Author:
Carl Warren, James M. Reeve, Jonathan Duchac
Publisher:
Cengage Learning

Financial Accounting: The Impact on Decision Make…
Accounting
ISBN:
9781305654174
Author:
Gary A. Porter, Curtis L. Norton
Publisher:
Cengage Learning

Survey of Accounting (Accounting I)
Accounting
ISBN:
9781305961883
Author:
Carl Warren
Publisher:
Cengage Learning