The following output models the factors that influence the price of a particular good. Calculate the standard error for the variable qual reg price quant qual Source Model Residual Total quant qual _cons SS O a. 5.622 O b. 0.019 OC 0.178 O d. 0.389 20582.878 22081.2331 42664.1111 df -.0586581 89.76477 2 price Coefficient Std. err. 53 55 775.711111 .0099625 MS 8.707455 10291.439 416.627039 Number of obs F(2, 53) Prob> F R-squared Adj R-squared Root MSE tP>|t| = -5.54 0.000 -.0752215 -0.33 0.744 -.4164046 10.31 0.000 72.29982 = 56 24.70 0.0000 0.4824 0.4629 20.411 [95% conf. interval] -.0352569 .2990884 187.2297
The following output models the factors that influence the price of a particular good. Calculate the standard error for the variable qual reg price quant qual Source Model Residual Total quant qual _cons SS O a. 5.622 O b. 0.019 OC 0.178 O d. 0.389 20582.878 22081.2331 42664.1111 df -.0586581 89.76477 2 price Coefficient Std. err. 53 55 775.711111 .0099625 MS 8.707455 10291.439 416.627039 Number of obs F(2, 53) Prob> F R-squared Adj R-squared Root MSE tP>|t| = -5.54 0.000 -.0752215 -0.33 0.744 -.4164046 10.31 0.000 72.29982 = 56 24.70 0.0000 0.4824 0.4629 20.411 [95% conf. interval] -.0352569 .2990884 187.2297

Algebra & Trigonometry with Analytic Geometry
13th Edition
ISBN:9781133382119
Author:Swokowski
Publisher:Swokowski
Chapter7: Analytic Trigonometry
Section7.6: The Inverse Trigonometric Functions
Problem 91E

Related questions
Question
10
![The following output models the factors that influence the price of a particular good. Calculate the standard error for the variable 'qual'.
reg price quant qual
Source
Model
Residual
Total
quant
qual
_cons
SS
O a. 5.622
O b. 0.019
OC 0.178
O d. 0.389
20582.878
22081.2331
42664.1111
df
-.0586581
89.76477
2
price Coefficient Std. err.
53
55 775.711111
.0099625
MS
8.707455
10291.439
416.627039
Number of obs
F(2, 53)
Prob> F
R-squared
Adj R-squared
Root MSE
t P>|t|
-5.54 0.000
-0.33 0.744
10.31
0.000
=
-.0752215
-.4164046
72.29982
=
56
24.70
0.0000
0.4824
0.4629
20.411
[95% conf. interval]
-.0352569
.2990884
187.2297](/v2/_next/image?url=https%3A%2F%2Fcontent.bartleby.com%2Fqna-images%2Fquestion%2F510422a1-7633-4f0c-8ba8-dce0185f1314%2F769560a2-85da-4fe8-887b-70650bfe114e%2Fm9uch99_processed.jpeg&w=3840&q=75)
Transcribed Image Text:The following output models the factors that influence the price of a particular good. Calculate the standard error for the variable 'qual'.
reg price quant qual
Source
Model
Residual
Total
quant
qual
_cons
SS
O a. 5.622
O b. 0.019
OC 0.178
O d. 0.389
20582.878
22081.2331
42664.1111
df
-.0586581
89.76477
2
price Coefficient Std. err.
53
55 775.711111
.0099625
MS
8.707455
10291.439
416.627039
Number of obs
F(2, 53)
Prob> F
R-squared
Adj R-squared
Root MSE
t P>|t|
-5.54 0.000
-0.33 0.744
10.31
0.000
=
-.0752215
-.4164046
72.29982
=
56
24.70
0.0000
0.4824
0.4629
20.411
[95% conf. interval]
-.0352569
.2990884
187.2297
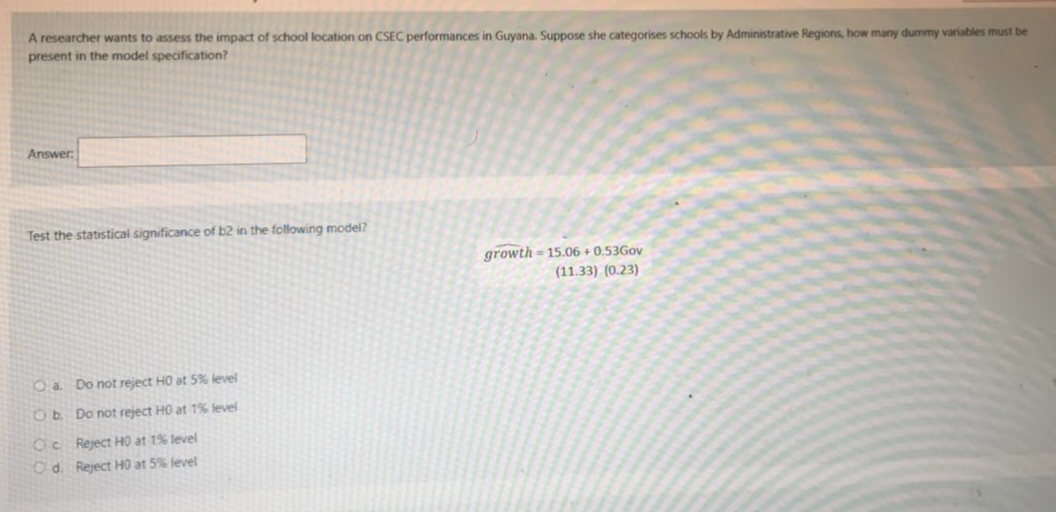
Transcribed Image Text:A researcher wants to assess the impact of school location on CSEC performances in Guyana. Suppose she categorises schools by Administrative Regions, how many dummy variables must be
present in the model specification?
Answer:
Test the statistical significance of b2 in the following model?
Oa. Do not reject H0 at 5% level
O b. Do not reject H0 at 1% level
Oc Reject H0 at 1% level
Od. Reject H0 at 5% level
growth 15.06+0.53Gov
(11.33) (0.23)
Expert Solution
This question has been solved!
Explore an expertly crafted, step-by-step solution for a thorough understanding of key concepts.

Step by step
Solved in 3 steps with 2 images

Recommended textbooks for you
Algebra & Trigonometry with Analytic Geometry
Algebra
ISBN:
9781133382119
Author:
Swokowski
Publisher:
Cengage
Algebra & Trigonometry with Analytic Geometry
Algebra
ISBN:
9781133382119
Author:
Swokowski
Publisher:
Cengage