The following regression output is for predicting the heart weight (in g) of cats from their body weight (in kg). The coecients are estimated using a dataset of 144 domestic cats. 20- 5- 2.0 2.5 3.0 3.5 4.0 Body weight (kg) Estimate Std. Error t value Pr(>t) (Intercept) -0.357 0.692 -0.515 0.607 body wt 4.034 0.250 16.119 0.000 = 1.452 R = 64.66% Rdi = 64.41% a) Write out the linear model. y - * poverty % b) Interpret the intercept. Expected heart weight of cats with no body weight is 4.034 kg Expected body weight of cats with no heart weight is 4.034 g For each additional 1g increase in heart weight, we expect body weight to decrease by 0.357 kg For each additional 1 g increase in heart weight, we expect body weight to increase by 0.357 kg For each additional 1 g increase in heart weight, we expect body weight to increase by 4.034 kg Expected heart weight of cats with no body weight is -0.357 kg Expected body weight of cats with no heart weight is -0.357 g For each additional 1 kg increase in body weight, we expect heart weight to decrease by 0.357 g For each additional 1 kg increase in body weight, we expect heart weight to increase by 4.034 g For each additional 1 kg increase in body weight, we expect heart weight to increase hy0 357 Heart weight )
The following regression output is for predicting the heart weight (in g) of cats from their body weight (in kg). The coecients are estimated using a dataset of 144 domestic cats. 20- 5- 2.0 2.5 3.0 3.5 4.0 Body weight (kg) Estimate Std. Error t value Pr(>t) (Intercept) -0.357 0.692 -0.515 0.607 body wt 4.034 0.250 16.119 0.000 = 1.452 R = 64.66% Rdi = 64.41% a) Write out the linear model. y - * poverty % b) Interpret the intercept. Expected heart weight of cats with no body weight is 4.034 kg Expected body weight of cats with no heart weight is 4.034 g For each additional 1g increase in heart weight, we expect body weight to decrease by 0.357 kg For each additional 1 g increase in heart weight, we expect body weight to increase by 0.357 kg For each additional 1 g increase in heart weight, we expect body weight to increase by 4.034 kg Expected heart weight of cats with no body weight is -0.357 kg Expected body weight of cats with no heart weight is -0.357 g For each additional 1 kg increase in body weight, we expect heart weight to decrease by 0.357 g For each additional 1 kg increase in body weight, we expect heart weight to increase by 4.034 g For each additional 1 kg increase in body weight, we expect heart weight to increase hy0 357 Heart weight )

Algebra & Trigonometry with Analytic Geometry
13th Edition
ISBN:9781133382119
Author:Swokowski
Publisher:Swokowski
Chapter7: Analytic Trigonometry
Section7.6: The Inverse Trigonometric Functions
Problem 94E

Related questions
Question
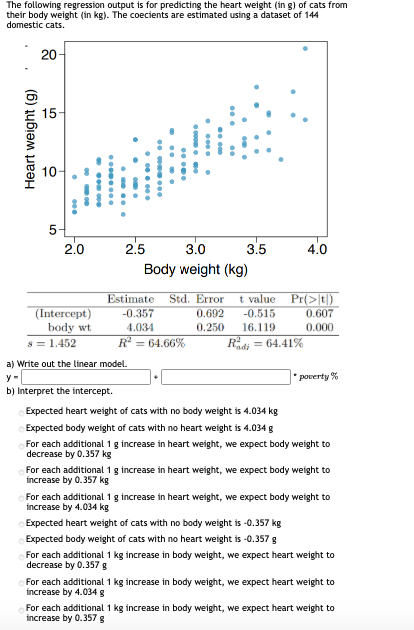
Transcribed Image Text:The following regression output is for predicting the heart weight (in g) of cats from
their body weight (in kg). The coecients are estimated using a dataset of 144
domestic cats.
20-
2.0
2.5
3.0
3.5
4.0
Body weight (kg)
Estimate
Std. Error
t value Pr(>|t)
(Intercept)
body wt.
-0.357
0.692
-0.515
0.607
4.034
0.250
16.119
0.000
s = 1.452
R = 64.66%
Radi = 64.41%
a) Write out the linear model.
* poverty %
b) Interpret the intercept.
Expected heart weight of cats with no body weight is 4.034 kg
Expected body weight of cats with no heart weight is 4.034 g
For each additional 1 g increase in heart weight, we expect body weight to
decrease by 0.357 kg
For each additional 1 g increase in heart weight, we expect body weight to
increase by 0.357 kg
For each additional 1 g increase in heart weight, we expect body weight to
increase by 4.034 kg
Expected heart weight of cats with no body weight is -0.357 kg
Expected body weight of cats with no heart weight is -0.357 g
For each additional 1 kg increase in body weight, we expect heart weight to
decrease by 0.357 g
For each additional 1 kg increase in body weight, we expect heart weight to
increase by 4.034 g
For each additional 1 kg increase in body weight, we expect heart weight to
increase by 0.3578
Heart weight )
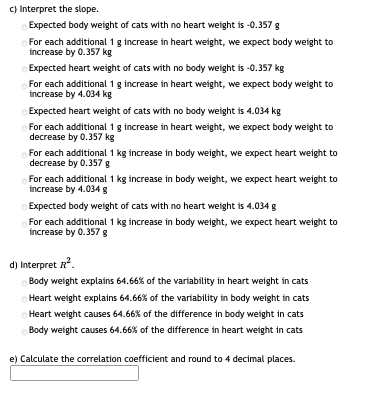
Transcribed Image Text:C) Interpret the slope.
Expected body weight of cats with no heart weight is -0.357 g
For each additional 1g increase in heart weight, we expect body weight to
increase by 0.357 kg
Expected heart weight of cats with no body weight is -0.357 kg
For each additional 1 g increase in heart weight, we expect body weight to
increase by 4.034 kg
Expected heart weight of cats with no body weight is 4.034 kg
For each additional 1 g increase in heart weight, we expect body weight to
decrease by 0.357 kg
For each additional 1 kg increase in body weight, we expect heart weight to
decrease by 0.357 g
For each additional 1 kg increase in body weight, we expect heart weight to
increase by 4.034 g
Expected body weight of cats with no heart weight is 4.034 g
For each additional 1 kg increase in body weight, we expect heart weight to
increase by 0.357g
d) Interpret R.
Body weight explains 64.66% of the variability in heart weight in cats
Heart weight explains 64.66% of the variability in body weight in cats
Heart weight causes 64.66% of the difference in body weight in cats
Body weight causes 64.66% of the difference in heart weight in cats
e) Calculate the correlation coefficient and round to 4 decimal places.
Expert Solution
This question has been solved!
Explore an expertly crafted, step-by-step solution for a thorough understanding of key concepts.

This is a popular solution!

Trending now
This is a popular solution!

Step by step
Solved in 2 steps

Recommended textbooks for you
Algebra & Trigonometry with Analytic Geometry
Algebra
ISBN:
9781133382119
Author:
Swokowski
Publisher:
Cengage


Algebra and Trigonometry (MindTap Course List)
Algebra
ISBN:
9781305071742
Author:
James Stewart, Lothar Redlin, Saleem Watson
Publisher:
Cengage Learning
Algebra & Trigonometry with Analytic Geometry
Algebra
ISBN:
9781133382119
Author:
Swokowski
Publisher:
Cengage
Algebra and Trigonometry (MindTap Course List)
Algebra
ISBN:
9781305071742
Author:
James Stewart, Lothar Redlin, Saleem Watson
Publisher:
Cengage Learning


Glencoe Algebra 1, Student Edition, 9780079039897…
Algebra
ISBN:
9780079039897
Author:
Carter
Publisher:
McGraw Hill

Functions and Change: A Modeling Approach to Coll…
Algebra
ISBN:
9781337111348
Author:
Bruce Crauder, Benny Evans, Alan Noell
Publisher:
Cengage Learning