The following results are from data where the dependent variable is the selling price of used cars, the independent variables are similar to those in the above regression along with some additional variables. The data were split into 2 samples and the following regression results were obtained from the split data. If we wanted to test for hetero
The following results are from data where the dependent variable is the selling price of used cars, the independent variables are similar to those in the above regression along with some additional variables. The data were split into 2 samples and the following regression results were obtained from the split data. If we wanted to test for hetero

Functions and Change: A Modeling Approach to College Algebra (MindTap Course List)
6th Edition
ISBN:9781337111348
Author:Bruce Crauder, Benny Evans, Alan Noell
Publisher:Bruce Crauder, Benny Evans, Alan Noell
Chapter5: A Survey Of Other Common Functions
Section5.6: Higher-degree Polynomials And Rational Functions
Problem 14SBE: Quartic Regression In Exercise S-8 through S-14, use regression to find a quartic model for the...

Related questions
Question
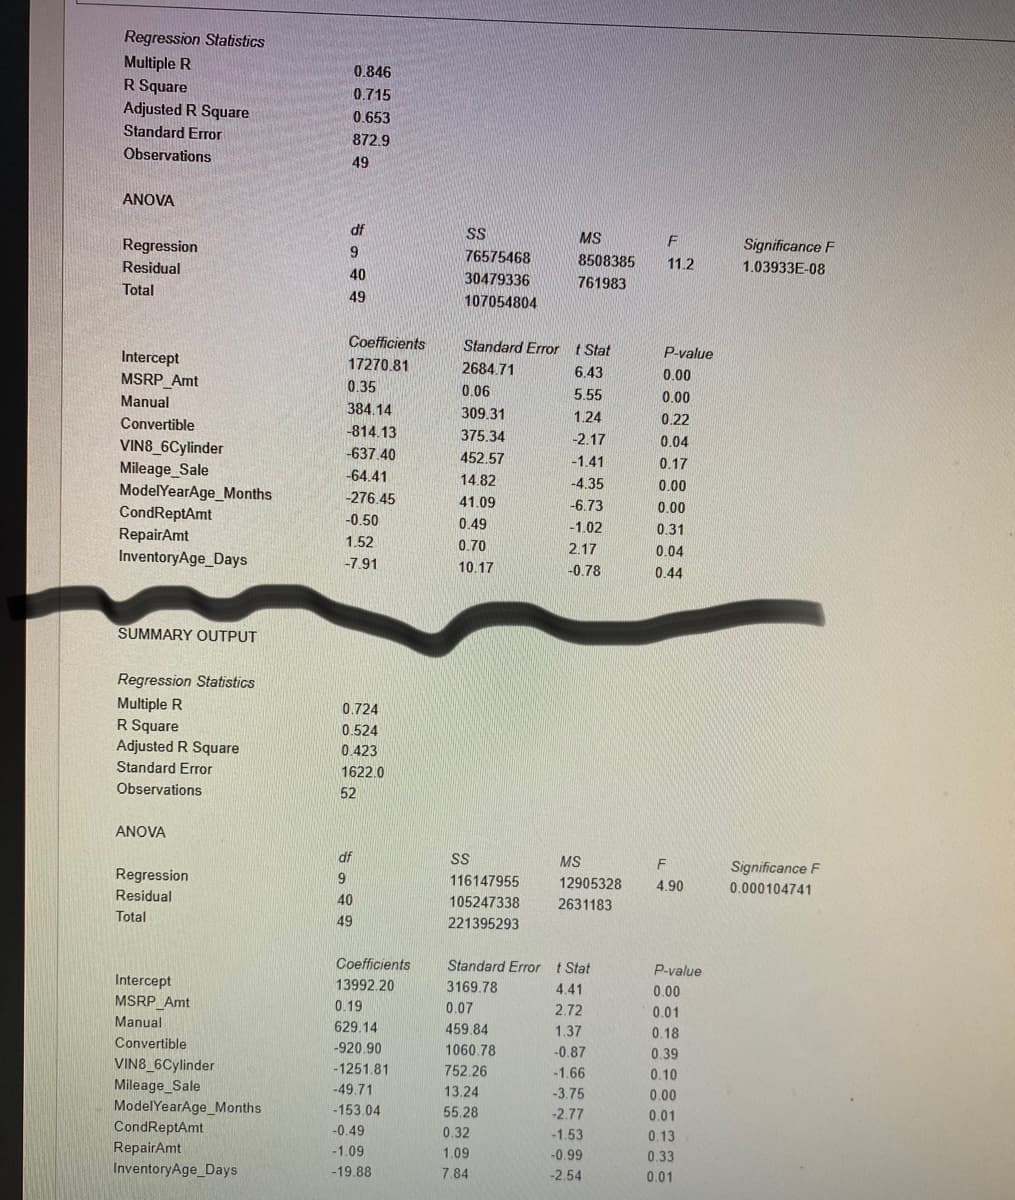
17) The following results are from data where the dependent variable is the selling price of used cars, the independent variables are similar to those in the above regression along with some additional variables. The data were split into 2 samples and the following regression results were obtained from the split data. If we wanted to test for heteroscedasticity, what is the test statistic?
(please round your answer to 2 decimal places)
**I explicitly need to know the test statistic**
Transcribed Image Text:Regression Statistics
Multiple R
R Square
Adjusted R Square
Standard Error
0.846
0.715
0.653
872.9
Observations
49
ANOVA
df
SS
MS
Regression
6.
Significance F
76575468
8508385
11.2
Residual
1.03933E-08
40
30479336
761983
Total
49
107054804
Coefficients
Standard Error t Stat
P-value
Intercept
MSRP_Amt
17270.81
2684.71
6.43
0.00
0.35
0.06
Manual
5.55
0.00
384.14
309.31
Convertible
1.24
0.22
-814.13
375.34
-2.17
0.04
VIN8_6Cylinder
Mileage_Sale
ModelYearAge_Months
CondReptAmt
RepairAmt
InventoryAge_Days
-637.40
452.57
-1.41
0.17
-64.41
14.82
-4.35
0.00
-276.45
41.09
-6.73
0.00
-0.50
0.49
-1.02
0.31
1.52
0.70
2.17
0.04
-7.91
10.17
-0.78
0.44
SUMMARY OUTPUT
Regression Statistics
Multiple R
R Square
Adjusted R Square
0.724
0.524
0.423
Standard Error
1622.0
Observations
52
ANOVA
df
MS
Significance F
Regression
Residual
116147955
12905328
4.90
0.000104741
40
105247338
2631183
Total
49
221395293
Coefficients
Standard Error t Stat
P-value
Intercept
MSRP_Amt
13992.20
3169.78
4.41
0.00
0.19
0.07
2.72
0.01
Manual
629.14
459.84
1.37
0.18
Convertible
-920.90
1060.78
-0.87
0.39
VIN8_6Cylinder
Mileage_Sale
ModelYearAge_Months
CondReptAmt
RepairAmt
InventoryAge_Days
-1251.81
752.26
-1.66
0.10
-49.71
13.24
-3.75
0.00
-153.04
55.28
-2.77
0.01
-0.49
0.32
-1.53
0.13
-1.09
1.09
-0.99
0.33
-19.88
7.84
-2,54
0.01
Expert Solution
This question has been solved!
Explore an expertly crafted, step-by-step solution for a thorough understanding of key concepts.

This is a popular solution!

Trending now
This is a popular solution!

Step by step
Solved in 3 steps

Recommended textbooks for you
Functions and Change: A Modeling Approach to Coll…
Algebra
ISBN:
9781337111348
Author:
Bruce Crauder, Benny Evans, Alan Noell
Publisher:
Cengage Learning


Algebra & Trigonometry with Analytic Geometry
Algebra
ISBN:
9781133382119
Author:
Swokowski
Publisher:
Cengage
Functions and Change: A Modeling Approach to Coll…
Algebra
ISBN:
9781337111348
Author:
Bruce Crauder, Benny Evans, Alan Noell
Publisher:
Cengage Learning
Algebra & Trigonometry with Analytic Geometry
Algebra
ISBN:
9781133382119
Author:
Swokowski
Publisher:
Cengage

College Algebra
Algebra
ISBN:
9781305115545
Author:
James Stewart, Lothar Redlin, Saleem Watson
Publisher:
Cengage Learning

Algebra and Trigonometry (MindTap Course List)
Algebra
ISBN:
9781305071742
Author:
James Stewart, Lothar Redlin, Saleem Watson
Publisher:
Cengage Learning