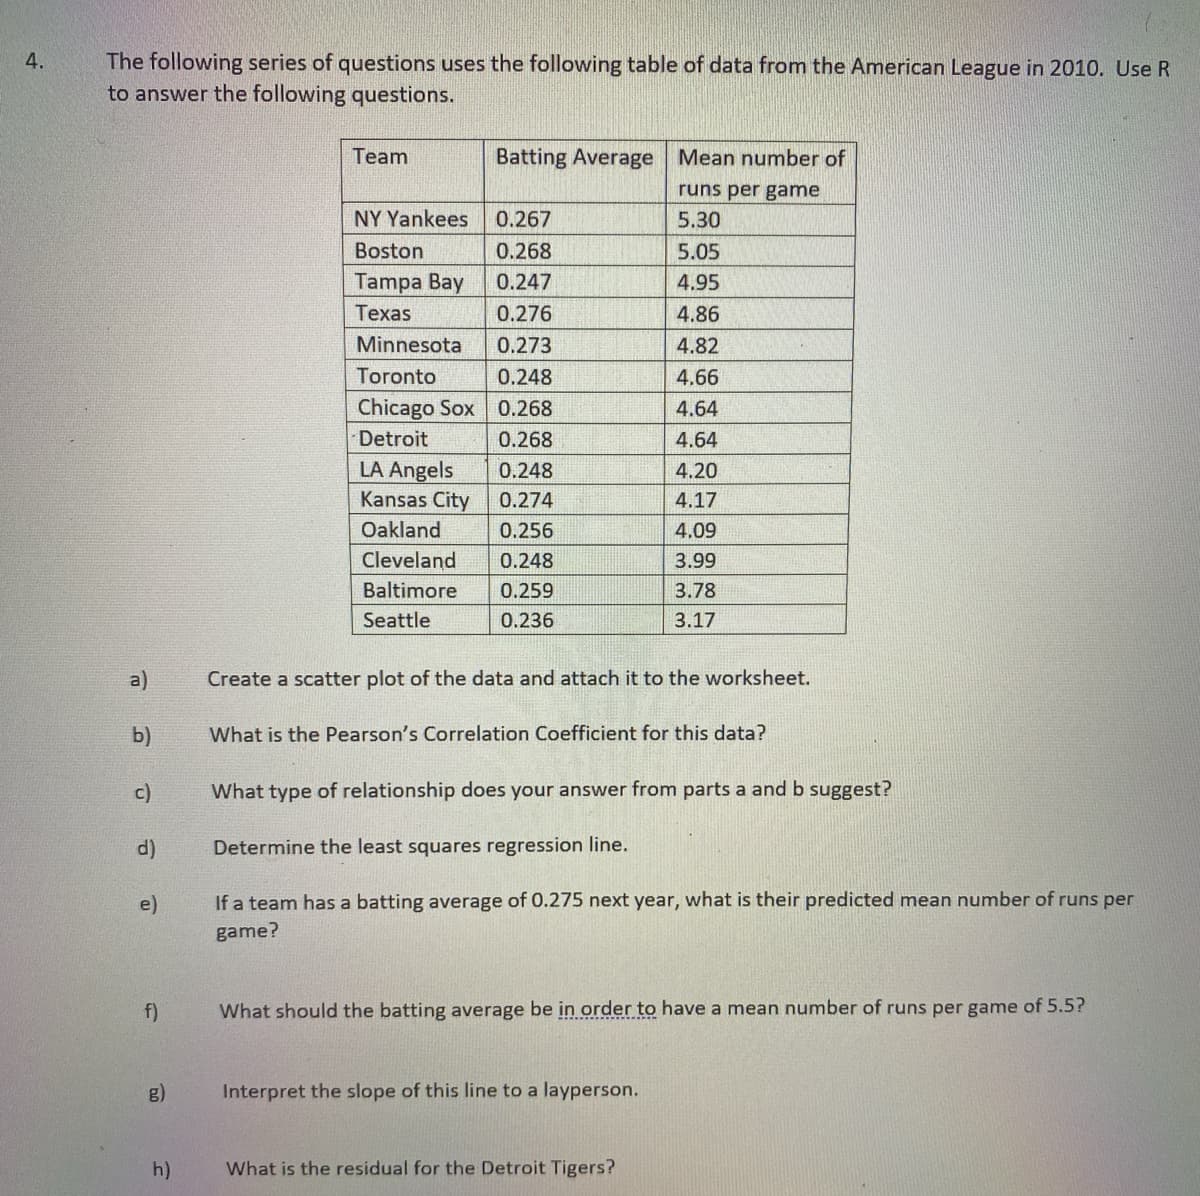
The following series of questions uses the following table of data from the American League in 2010. Use R to answer the following questions. Team Batting Average Mean number of runs per game NY Yankees 0.267 5.30 Boston 0.268 5.05 Tampa Bay 0.247 4.95 Texas 0.276 4.86 Minnesota 0.273 4.82 Toronto 0.248 4.66 Chicago Sox 0.268 4.64 Detroit 0.268 4.64 LA Angels Kansas City 0.248 4.20 0.274 4.17 Oakland 0.256 4.09 Cleveland 0.248 3.99 Baltimore 0.259 3.78 Seattle 0.236 3.17 a) Create a scatter plot of the data and attach it to the worksheet. b) What is the Pearson's Correlation Coefficient for this data? c) What type of relationship does your answer from parts a and b suggest? d) Determine the least squares regression line. e) If a team has a batting average of 0.275 next year, what is their predicted mean number of runs per game? f) What should the batting average be in order to have a mean number of runs per game of 5.5?
The following series of questions uses the following table of data from the American League in 2010. Use R to answer the following questions. Team Batting Average Mean number of runs per game NY Yankees 0.267 5.30 Boston 0.268 5.05 Tampa Bay 0.247 4.95 Texas 0.276 4.86 Minnesota 0.273 4.82 Toronto 0.248 4.66 Chicago Sox 0.268 4.64 Detroit 0.268 4.64 LA Angels Kansas City 0.248 4.20 0.274 4.17 Oakland 0.256 4.09 Cleveland 0.248 3.99 Baltimore 0.259 3.78 Seattle 0.236 3.17 a) Create a scatter plot of the data and attach it to the worksheet. b) What is the Pearson's Correlation Coefficient for this data? c) What type of relationship does your answer from parts a and b suggest? d) Determine the least squares regression line. e) If a team has a batting average of 0.275 next year, what is their predicted mean number of runs per game? f) What should the batting average be in order to have a mean number of runs per game of 5.5?

Glencoe Algebra 1, Student Edition, 9780079039897, 0079039898, 2018
18th Edition
ISBN:9780079039897
Author:Carter
Publisher:Carter
Chapter10: Statistics
Section10.4: Distributions Of Data
Problem 19PFA

Related questions
Topic Video
Question
100%
please dont use excel to sovle this problem
Transcribed Image Text:The following series of questions uses the following table of data from the American League in 2010. Use R
to answer the following questions.
4.
Team
Batting Average Mean number of
runs per game
NY Yankees
0.267
5.30
Boston
0.268
5.05
Tampa Bay
0.247
4.95
Техas
0.276
4.86
Minnesota
0.273
4.82
Toronto
0.248
4.66
Chicago Sox
0.268
4.64
Detroit
0.268
4.64
LA Angels
Kansas City
0.248
4.20
0.274
4.17
Oakland
0.256
4.09
Cleveland
0.248
3.99
Baltimore
0.259
3.78
Seattle
0.236
3.17
a)
Create a scatter plot of the data and attach it to the worksheet.
b)
What is the Pearson's Correlation Coefficient for this data?
c)
What type of relationship does your answer from parts a and b suggest?
d)
Determine the least squares regression line.
e)
If a team has a batting average of 0.275 next year, what is their predicted mean number of runs per
game?
f)
What should the batting average be in order to have a mean number of runs per game of 5.5?
g)
Interpret the slope of this line to a layperson.
h)
What is the residual for the Detroit Tigers?
Expert Solution
This question has been solved!
Explore an expertly crafted, step-by-step solution for a thorough understanding of key concepts.

Step by step
Solved in 3 steps with 3 images

Knowledge Booster


Learn more about
Need a deep-dive on the concept behind this application? Look no further. Learn more about this topic, statistics and related others by exploring similar questions and additional content below.Recommended textbooks for you
Glencoe Algebra 1, Student Edition, 9780079039897…
Algebra
ISBN:
9780079039897
Author:
Carter
Publisher:
McGraw Hill
Glencoe Algebra 1, Student Edition, 9780079039897…
Algebra
ISBN:
9780079039897
Author:
Carter
Publisher:
McGraw Hill