The following set of binary data represents a sample of (n=25) trees is a forest. For each tree, the two variables measured are DBH (diameter at breast height, in meters) and Height (height of tree, in meters) Each of the data points represents one of the n=25 trees that was measured and is in the form (DBH, Height) (0.4, 8.5), (0.45, 16.0), (0.6, 26.5), (0.6, 21.0), (0.65, 12.5), (0.8, 26.0), (0.85, 19.5), (0.9, 29.5), (1.05, 13.5), (1.15, 26.5), (1.3, 21.5), (1.35, 30.5), (1.55, 27.0), (1.65, 31.5), (1.9, 29.5), (1.95, 39.0), (2.0, 22.5), (2.2, 34.5), (2.25, 23.5), (2.3, 30.0), (2.5, 37.5), (2.55, 25.5), (2.7, 29.0), (2.8, 36.5), (2.85, 41.5) For this data, produce a scatter plot with DBH on the horizontal axis and Height on the vertical axis. Make observations regarding the correlation between the variables. Is the correlation positive or negative? Is it weak, moderate, or strong? Is it linear or non-linear?
The following set of binary data represents a sample of (n=25) trees is a forest. For each tree, the two variables measured are DBH (diameter at breast height, in meters) and Height (height of tree, in meters) Each of the data points represents one of the n=25 trees that was measured and is in the form (DBH, Height) (0.4, 8.5), (0.45, 16.0), (0.6, 26.5), (0.6, 21.0), (0.65, 12.5), (0.8, 26.0), (0.85, 19.5), (0.9, 29.5), (1.05, 13.5), (1.15, 26.5), (1.3, 21.5), (1.35, 30.5), (1.55, 27.0), (1.65, 31.5), (1.9, 29.5), (1.95, 39.0), (2.0, 22.5), (2.2, 34.5), (2.25, 23.5), (2.3, 30.0), (2.5, 37.5), (2.55, 25.5), (2.7, 29.0), (2.8, 36.5), (2.85, 41.5) For this data, produce a scatter plot with DBH on the horizontal axis and Height on the vertical axis. Make observations regarding the correlation between the variables. Is the correlation positive or negative? Is it weak, moderate, or strong? Is it linear or non-linear?

Glencoe Algebra 1, Student Edition, 9780079039897, 0079039898, 2018
18th Edition
ISBN:9780079039897
Author:Carter
Publisher:Carter
Chapter10: Statistics
Section10.1: Measures Of Center
Problem 14PPS

Related questions
Topic Video
Question
100%
Can someone please help me out with these questions.
Transcribed Image Text:QUESTION 16
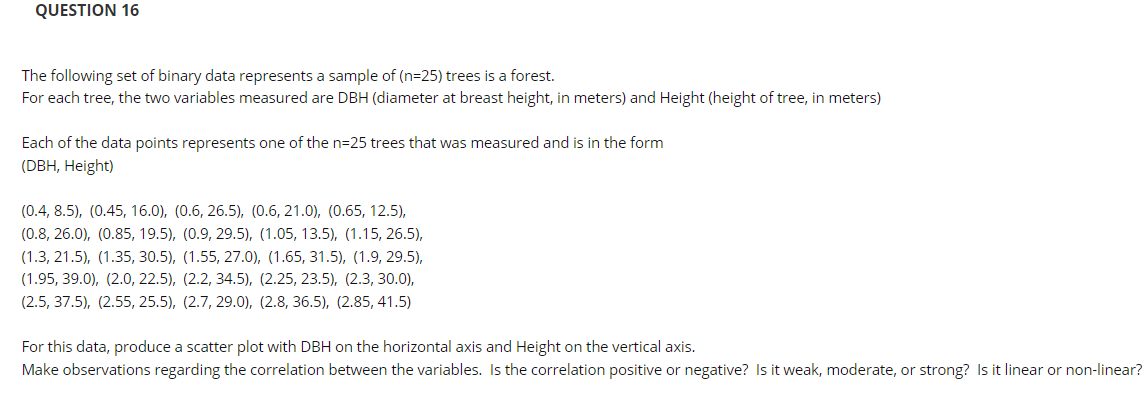
The following set of binary data represents a sample of (n=25) trees is a forest.
For each tree, the two variables measured are DBH (diameter at breast height, in meters) and Height (height of tree, in meters)
Each of the data points represents one of the n=25 trees that was measured and is in the form
(DBH, Height)
(0.4, 8.5), (0.45, 16.0), (0.6, 26.5), (0.6, 21.0), (0.65, 12.5),
(0.8, 26.0), (0.85, 19.5), (0.9, 29.5), (1.05, 13.5), (1.15, 26.5),
(1.3, 21.5), (1.35, 30.5), (1.55, 27.0), (1.65, 31.5), (1.9, 29.5),
(1.95, 39.0), (2.0, 22.5), (2.2, 34.5), (2.25, 23.5), (2.3, 30.0),
(2.5, 37.5), (2.55, 25.5), (2.7, 29.0), (2.8, 36.5), (2.85, 41.5)
For this data, produce a scatter plot with DBH on the horizontal axis and Height on the vertical axis.
Make observations regarding the correlation between the variables. Is the correlation positive or negative? Is it weak, moderate, or strong? Is it linear or non-linear?
Expert Solution
This question has been solved!
Explore an expertly crafted, step-by-step solution for a thorough understanding of key concepts.

Step by step
Solved in 2 steps with 2 images

Knowledge Booster


Learn more about
Need a deep-dive on the concept behind this application? Look no further. Learn more about this topic, statistics and related others by exploring similar questions and additional content below.Recommended textbooks for you
Glencoe Algebra 1, Student Edition, 9780079039897…
Algebra
ISBN:
9780079039897
Author:
Carter
Publisher:
McGraw Hill

Functions and Change: A Modeling Approach to Coll…
Algebra
ISBN:
9781337111348
Author:
Bruce Crauder, Benny Evans, Alan Noell
Publisher:
Cengage Learning

Algebra & Trigonometry with Analytic Geometry
Algebra
ISBN:
9781133382119
Author:
Swokowski
Publisher:
Cengage
Glencoe Algebra 1, Student Edition, 9780079039897…
Algebra
ISBN:
9780079039897
Author:
Carter
Publisher:
McGraw Hill
Functions and Change: A Modeling Approach to Coll…
Algebra
ISBN:
9781337111348
Author:
Bruce Crauder, Benny Evans, Alan Noell
Publisher:
Cengage Learning
Algebra & Trigonometry with Analytic Geometry
Algebra
ISBN:
9781133382119
Author:
Swokowski
Publisher:
Cengage