The following table gives information on the amount (in dollars) Of the electric bills for a samle of 40 families Electric bill Number of families 2 4-8 16-20 12-16 8 8-12 20-24 11 14 d)Estimate the sample median.
The following table gives information on the amount (in dollars) Of the electric bills for a samle of 40 families Electric bill Number of families 2 4-8 16-20 12-16 8 8-12 20-24 11 14 d)Estimate the sample median.

Holt Mcdougal Larson Pre-algebra: Student Edition 2012
1st Edition
ISBN:9780547587776
Author:HOLT MCDOUGAL
Publisher:HOLT MCDOUGAL
Chapter11: Data Analysis And Probability
Section11.4: Collecting Data
Problem 6E

Related questions

Topic Video
Question
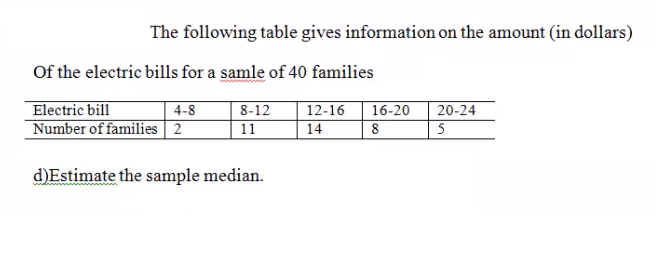
Transcribed Image Text:The following table gives information on the amount (in dollars)
Of the electric bills for a samle of 40 families
Electric bill
Number of families 2
4-8
8-12
11
12-16
16-20
8
20-24
14
d)Estimate the sample median.
Expert Solution
This question has been solved!
Explore an expertly crafted, step-by-step solution for a thorough understanding of key concepts.

Step by step
Solved in 2 steps

Knowledge Booster


Learn more about
Need a deep-dive on the concept behind this application? Look no further. Learn more about this topic, statistics and related others by exploring similar questions and additional content below.Recommended textbooks for you
Holt Mcdougal Larson Pre-algebra: Student Edition…
Algebra
ISBN:
9780547587776
Author:
HOLT MCDOUGAL
Publisher:
HOLT MCDOUGAL
Holt Mcdougal Larson Pre-algebra: Student Edition…
Algebra
ISBN:
9780547587776
Author:
HOLT MCDOUGAL
Publisher:
HOLT MCDOUGAL