The following table gives information on the amount of sugar (in grams) and the calorie count in one serving of a sample of 13 varieties of cereal. Sugar 3 15 15 11 6 7 3 7 14 20 4 14 (grams) Calories 120 200 140 110 120 80 190 100 120 190 190 110 120 a. Determine the standard deviation of errors. Round your answer to two decimal places. Se = i b. Find the coefficient of determination and give a brief interpretation of it. Round your answer for r to two decimal places and your answer for the percentage to the nearest integer. i i % of the * is explained by the regression model.
The following table gives information on the amount of sugar (in grams) and the calorie count in one serving of a sample of 13 varieties of cereal. Sugar 3 15 15 11 6 7 3 7 14 20 4 14 (grams) Calories 120 200 140 110 120 80 190 100 120 190 190 110 120 a. Determine the standard deviation of errors. Round your answer to two decimal places. Se = i b. Find the coefficient of determination and give a brief interpretation of it. Round your answer for r to two decimal places and your answer for the percentage to the nearest integer. i i % of the * is explained by the regression model.

Glencoe Algebra 1, Student Edition, 9780079039897, 0079039898, 2018
18th Edition
ISBN:9780079039897
Author:Carter
Publisher:Carter
Chapter10: Statistics
Section10.4: Distributions Of Data
Problem 19PFA

Related questions
Question
I'm having a hard time with this question, how do i solve for standard deviation of errors and coefficient of determination?
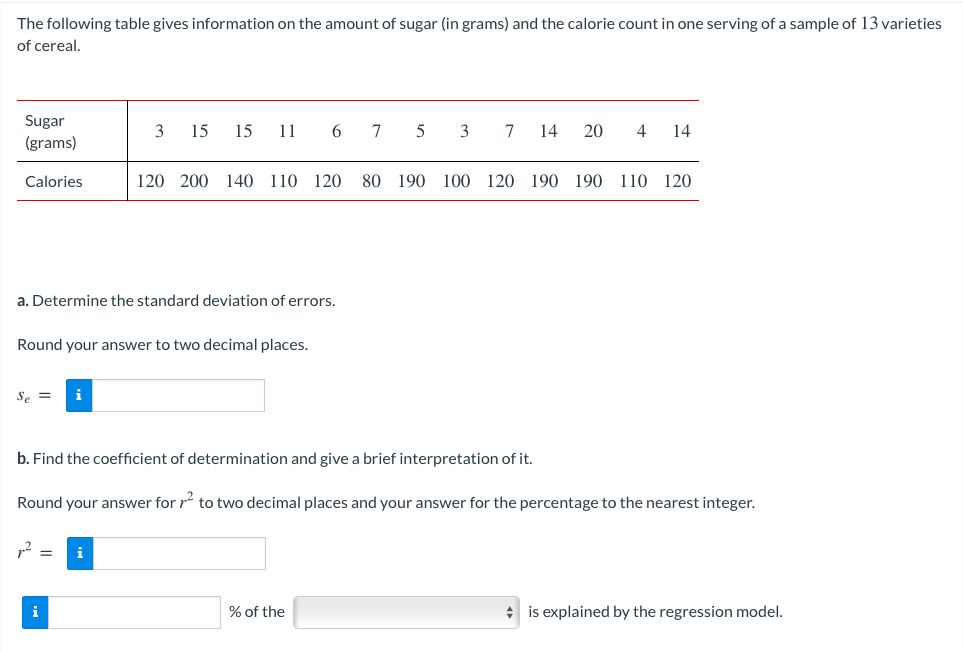
Transcribed Image Text:The following table gives information on the amount of sugar (in grams) and the calorie count in one serving of a sample of 13 varieties
of cereal.
Sugar
3 15
15
11
6
7
5
3
7
14
20
4
14
(grams)
Calories
120 200 140 110 120
80 190 100 120 190 190 110 120
a. Determine the standard deviation of errors.
Round your answer to two decimal places.
Se =
i
b. Find the coefficient of determination and give a brief interpretation of it.
Round your answer for r to two decimal places and your answer for the percentage to the nearest integer.
i
% of the
* is explained by the regression model.
Expert Solution
This question has been solved!
Explore an expertly crafted, step-by-step solution for a thorough understanding of key concepts.

Step by step
Solved in 2 steps with 1 images

Recommended textbooks for you
Glencoe Algebra 1, Student Edition, 9780079039897…
Algebra
ISBN:
9780079039897
Author:
Carter
Publisher:
McGraw Hill
Glencoe Algebra 1, Student Edition, 9780079039897…
Algebra
ISBN:
9780079039897
Author:
Carter
Publisher:
McGraw Hill