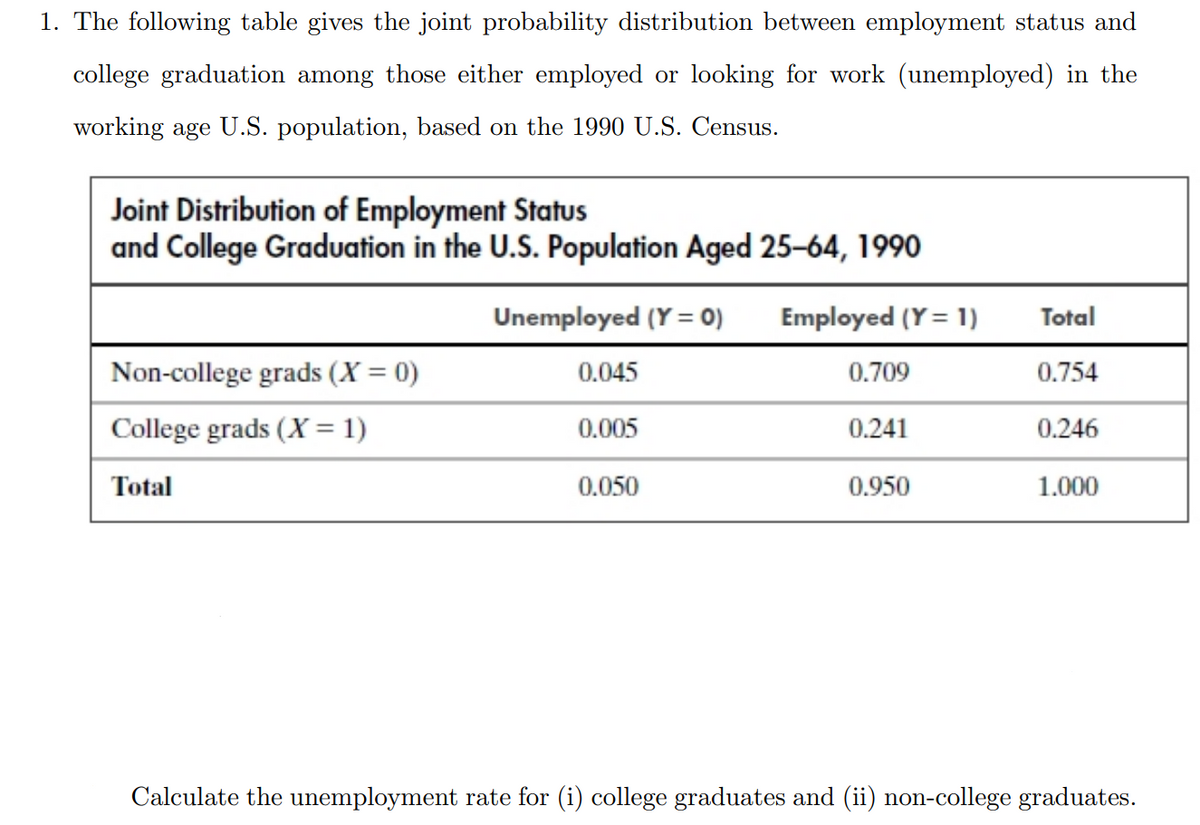
The following table gives the joint probability distribution between employment status and college graduation among those either employed or looking for work (unemployed) in the working age U.S. population, based on the 1990 U.S. Census. Joint Distribution of Employment Status and College Graduation in the U.S. Population Aged 25-64, 1990
The following table gives the joint probability distribution between employment status and college graduation among those either employed or looking for work (unemployed) in the working age U.S. population, based on the 1990 U.S. Census. Joint Distribution of Employment Status and College Graduation in the U.S. Population Aged 25-64, 1990
Chapter8: Sequences, Series,and Probability
Section8.7: Probability
Problem 4ECP: Show that the probability of drawing a club at random from a standard deck of 52 playing cards is...
Related questions
Question

Transcribed Image Text:1. The following table gives the joint probability distribution between employment status and
college graduation among those either employed or looking for work (unemployed) in the
working age U.S. population, based on the 1990 U.S. Census.
Joint Distribution of Employment Status
and College Graduation in the U.S. Population Aged 25-64, 1990
Unemployed (Y = 0)
Non-college grads (X = 0)
College grads (X= 1)
Total
0.045
0.005
0.050
Employed (Y= 1)
0.709
0.241
0.950
Total
0.754
0.246
1.000
Calculate the unemployment rate for (i) college graduates and (ii) non-college graduates.
Expert Solution
This question has been solved!
Explore an expertly crafted, step-by-step solution for a thorough understanding of key concepts.
This is a popular solution!
Trending now
This is a popular solution!
Step by step
Solved in 2 steps

Recommended textbooks for you


College Algebra
Algebra
ISBN:
9781305115545
Author:
James Stewart, Lothar Redlin, Saleem Watson
Publisher:
Cengage Learning


College Algebra
Algebra
ISBN:
9781305115545
Author:
James Stewart, Lothar Redlin, Saleem Watson
Publisher:
Cengage Learning