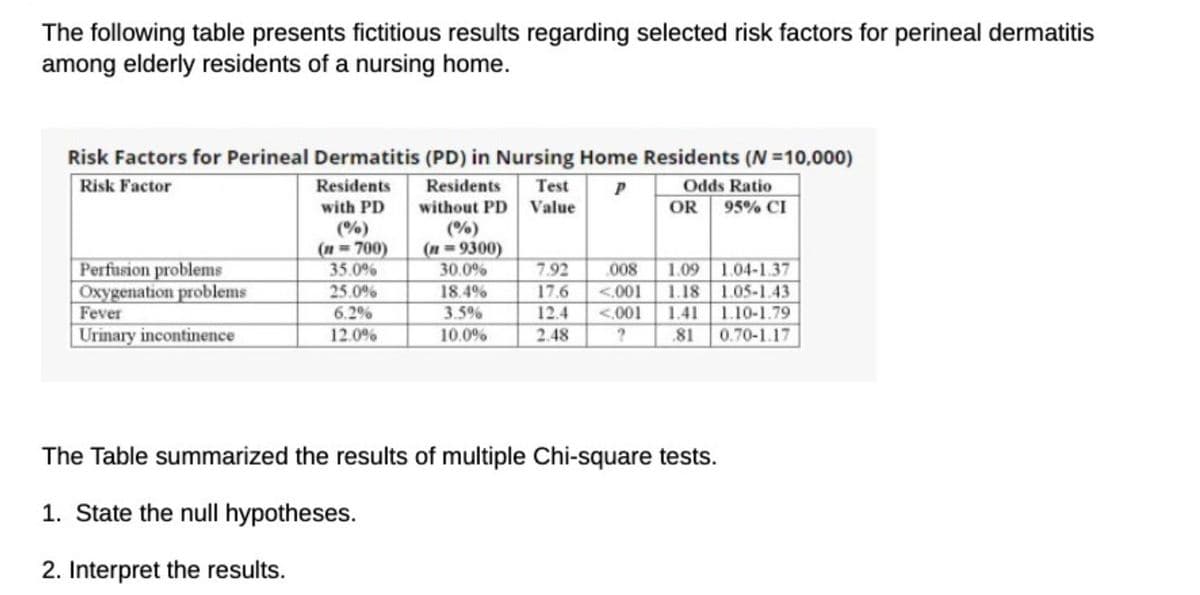
The following table presents fictitious results regarding selected risk factors for perineal dermatitis among elderly residents of a nursing home. Risk Factors for Perineal Dermatitis (PD) in Nursing Home Residents (N =10,000) Risk Factor Residents Residents Test Odds Ratio with PD without PD Value OR 95% CI Perfusion problems Oxygenation problems Fever (%) (n = 700) 35.0% 25.0% (%) (n= 9300) 30.0% 18.4% 1.09 1.04-1.37 1.18 1.05-1.43 1.10-1.79 0.70-1.17 7.92 17.6 .008 <.001 <.001 6.2% 3.5% 12.4 1.41 Urinary incontinence 12.0% 10.0% 2.48 81 The Table summarized the results of multiple Chi-square tests.
The following table presents fictitious results regarding selected risk factors for perineal dermatitis among elderly residents of a nursing home. Risk Factors for Perineal Dermatitis (PD) in Nursing Home Residents (N =10,000) Risk Factor Residents Residents Test Odds Ratio with PD without PD Value OR 95% CI Perfusion problems Oxygenation problems Fever (%) (n = 700) 35.0% 25.0% (%) (n= 9300) 30.0% 18.4% 1.09 1.04-1.37 1.18 1.05-1.43 1.10-1.79 0.70-1.17 7.92 17.6 .008 <.001 <.001 6.2% 3.5% 12.4 1.41 Urinary incontinence 12.0% 10.0% 2.48 81 The Table summarized the results of multiple Chi-square tests.

Linear Algebra: A Modern Introduction
4th Edition
ISBN:9781285463247
Author:David Poole
Publisher:David Poole
Chapter7: Distance And Approximation
Section7.3: Least Squares Approximation
Problem 31EQ

Related questions

Question
Transcribed Image Text:The following table presents fictitious results regarding selected risk factors for perineal dermatitis
among elderly residents of a nursing home.
Risk Factors for Perineal Dermatitis (PD) in Nursing Home Residents (N =10,000)
Risk Factor
Odds Ratio
95% CI
Residents
Residents
Test
with PD
(%)
(n = 700)
35.0%
without PD
Value
OR
Perfusion problems
Oxygenation problems
Fever
(%)
(n=9300)
30.0%
18.4%
3.5%
1.09 1.04-1.37
1.18 1.05-1.43
1.41 1.10-1.79
0.70-1.17
7.92
17.6
.008
25.0%
<.001
<.001
6.2%
12.4
Urinary incontinence
12.0%
10.0%
2.48
.81
The Table summarized the results of multiple Chi-square tests.
1. State the null hypotheses.
2. Interpret the results.
Expert Solution
This question has been solved!
Explore an expertly crafted, step-by-step solution for a thorough understanding of key concepts.

This is a popular solution!

Trending now
This is a popular solution!

Step by step
Solved in 2 steps

Knowledge Booster


Learn more about
Need a deep-dive on the concept behind this application? Look no further. Learn more about this topic, statistics and related others by exploring similar questions and additional content below.Recommended textbooks for you
Linear Algebra: A Modern Introduction
Algebra
ISBN:
9781285463247
Author:
David Poole
Publisher:
Cengage Learning

Glencoe Algebra 1, Student Edition, 9780079039897…
Algebra
ISBN:
9780079039897
Author:
Carter
Publisher:
McGraw Hill
Linear Algebra: A Modern Introduction
Algebra
ISBN:
9781285463247
Author:
David Poole
Publisher:
Cengage Learning
Glencoe Algebra 1, Student Edition, 9780079039897…
Algebra
ISBN:
9780079039897
Author:
Carter
Publisher:
McGraw Hill