The following table reports real GDP per person for several different economies in the years 1960 and 2010. It also gives each economy's average annual growth rate during this period. For example, real GDP per person in the Central African Republic was $1,010 in 1960, and it actually declined to $628 by 2010. The Central African Republic's average annual growth rate during this period was -0.95%, and it was the poorest economy in the table in the year 2010. The real GDP-per-person figures are denominated in U.S. dollars with a base year of 2005. The following exercises will help you to understand the different growth experiences of these economies.
The following table reports real GDP per person for several different economies in the years 1960 and 2010. It also gives each economy's average annual growth rate during this period. For example, real GDP per person in the Central African Republic was $1,010 in 1960, and it actually declined to $628 by 2010. The Central African Republic's average annual growth rate during this period was -0.95%, and it was the poorest economy in the table in the year 2010. The real GDP-per-person figures are denominated in U.S. dollars with a base year of 2005. The following exercises will help you to understand the different growth experiences of these economies.

Essentials of Economics (MindTap Course List)
8th Edition
ISBN:9781337091992
Author:N. Gregory Mankiw
Publisher:N. Gregory Mankiw
Chapter15: Measuring A Nation's Income
Section: Chapter Questions
Problem 7PA

Related questions
Question
The following table reports real GDP per person for several different economies in the years 1960 and 2010. It also gives each economy's average annual growth rate during this period. For example, real GDP per person in the Central African Republic was $1,010 in 1960, and it actually declined to $628 by 2010. The Central African Republic's average annual growth rate during this period was -0.95%, and it was the poorest economy in the table in the year 2010.
The real GDP-per-person figures are denominated in U.S. dollars with a base year of 2005. The following exercises will help you to understand the different growth experiences of these economies.
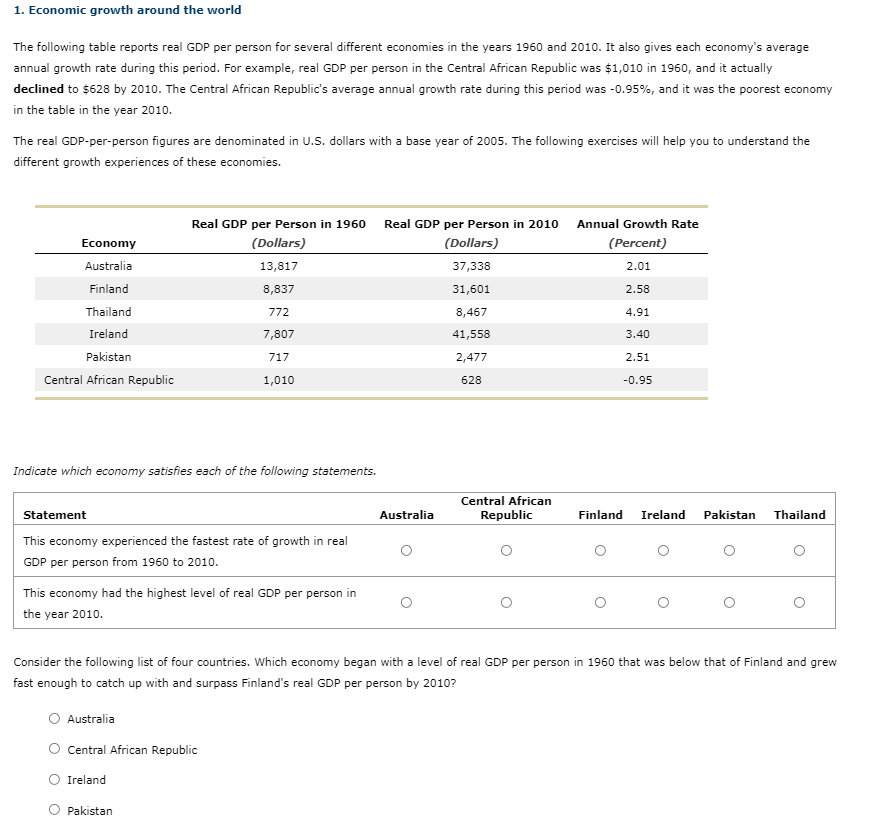
Transcribed Image Text:1. Economic growth around the world
The following table reports real GDP per person for several different economies in the years 1960 and 2010. It also gives each economy's average
annual growth rate during this period. For example, real GDP per person in the Central African Republic was $1,010 in 1960, and it actually
declined to $628 by 2010. The Central African Republic's average annual growth rate during this period was -0.95%, and it was the poorest economy
in the table in the year 2010.
The real GDP-per-person figures are denominated in U.S. dollars with a base year of 2005. The following exercises will help you to understand the
different growth experiences of these economies.
Real GDP per Person in 1960
Real GDP per Person in 2010 Annual Growth Rate
Economy
(Dollars)
(Dollars)
(Percent)
Australia
13,817
37,338
2.01
Finland
8,837
31,601
2.58
Thailand
772
8,467
4.91
Ireland
7,807
41,558
3.40
Pakistan
717
2,477
2.51
Central African Republic
1,010
628
-0.95
Indicate which economy satisfies each of the following statements.
Central African
Republic
Statement
Australia
Finland
Ireland
Pakistan
Thailand
This economy experienced the fastest rate of growth in real
GDP per person from 1960 to 2010.
This economy had the highest level of real GDP per person in
the year 2010.
Consider the following list of four countries. Which economy began with a level of real GDP per person in 1960 that was below that of Finland and grew
fast enough to catch up with and surpass Finland's real GDP per person by 2010?
Australia
O Central African Republic
O Ireland
Pakistan
Expert Solution
This question has been solved!
Explore an expertly crafted, step-by-step solution for a thorough understanding of key concepts.

This is a popular solution!

Trending now
This is a popular solution!

Step by step
Solved in 2 steps with 1 images

Recommended textbooks for you
Essentials of Economics (MindTap Course List)
Economics
ISBN:
9781337091992
Author:
N. Gregory Mankiw
Publisher:
Cengage Learning

Brief Principles of Macroeconomics (MindTap Cours…
Economics
ISBN:
9781337091985
Author:
N. Gregory Mankiw
Publisher:
Cengage Learning

Principles of Economics 2e
Economics
ISBN:
9781947172364
Author:
Steven A. Greenlaw; David Shapiro
Publisher:
OpenStax
Essentials of Economics (MindTap Course List)
Economics
ISBN:
9781337091992
Author:
N. Gregory Mankiw
Publisher:
Cengage Learning
Brief Principles of Macroeconomics (MindTap Cours…
Economics
ISBN:
9781337091985
Author:
N. Gregory Mankiw
Publisher:
Cengage Learning
Principles of Economics 2e
Economics
ISBN:
9781947172364
Author:
Steven A. Greenlaw; David Shapiro
Publisher:
OpenStax

Principles of Economics (MindTap Course List)
Economics
ISBN:
9781305585126
Author:
N. Gregory Mankiw
Publisher:
Cengage Learning

Principles of Economics, 7th Edition (MindTap Cou…
Economics
ISBN:
9781285165875
Author:
N. Gregory Mankiw
Publisher:
Cengage Learning

Principles of Macroeconomics (MindTap Course List)
Economics
ISBN:
9781285165912
Author:
N. Gregory Mankiw
Publisher:
Cengage Learning