The following table shows a money demand schedule, which is the quantity of money demanded at various price levels (PP). Fill in the Value of Money column in the following table. Now consider the relationship between the price level and the quantity of money that people demand. The lower the price level, the ____ (more/less) money the typical transaction requires, and the _____ (more/less) money people will wish to hold in the form of currency or demand deposits. Assume that the Fed initially fixes the quantity of money supplied at $2.5 billion. Use the orange line (square symbol) to plot the initial money supply (MS1MS1) set by the Fed. Then, referring to the previous table, use the blue connected points (circle symbol) to graph the money demand curve. According to your graph, the equilibrium value of money is ______ , therefore the equilibrium price level is _____ Now, suppose that the Fed increases the money supply from the initial level of $2.5 billion to $4 billion. In order to increase the money supply, the Fed can use open market operations to _____ (sell bonds to/buy bonds from) the public. Use the purple line (diamond symbol) to plot the new money supply (MS2MS2). Immediately after the Fed changes the money supply from its initial equilibrium level, the quantity of money supplied is ____ (greater/less) than the quantity of money demanded at the initial equilibrium. This expansion in the money supply will ______ (increase/reduce) people's demand for goods and services. In the long run, since the economy's ability to produce goods and services has not changed, the prices of goods and services will _____ (rise/fall) and the value of money will _____ (rise/fall) .
The following table shows a money demand schedule, which is the quantity of money demanded at various price levels (PP). Fill in the Value of Money column in the following table. Now consider the relationship between the price level and the quantity of money that people demand. The lower the price level, the ____ (more/less) money the typical transaction requires, and the _____ (more/less) money people will wish to hold in the form of currency or demand deposits. Assume that the Fed initially fixes the quantity of money supplied at $2.5 billion. Use the orange line (square symbol) to plot the initial money supply (MS1MS1) set by the Fed. Then, referring to the previous table, use the blue connected points (circle symbol) to graph the money demand curve. According to your graph, the equilibrium value of money is ______ , therefore the equilibrium price level is _____ Now, suppose that the Fed increases the money supply from the initial level of $2.5 billion to $4 billion. In order to increase the money supply, the Fed can use open market operations to _____ (sell bonds to/buy bonds from) the public. Use the purple line (diamond symbol) to plot the new money supply (MS2MS2). Immediately after the Fed changes the money supply from its initial equilibrium level, the quantity of money supplied is ____ (greater/less) than the quantity of money demanded at the initial equilibrium. This expansion in the money supply will ______ (increase/reduce) people's demand for goods and services. In the long run, since the economy's ability to produce goods and services has not changed, the prices of goods and services will _____ (rise/fall) and the value of money will _____ (rise/fall) .

Chapter13: Inflation
Section: Chapter Questions
Problem 16SQ

Related questions
Question
2. Money supply, money demand , and adjustment to monetary equilibrium
The following table shows a money demand schedule, which is the quantity of money demanded at various price levels (PP).
Fill in the Value of Money column in the following table.
Now consider the relationship between the price level and the quantity of money that people demand. The lower the price level, the ____ (more/less) money the typical transaction requires, and the _____ (more/less) money people will wish to hold in the form of currency or demand deposits.
Assume that the Fed initially fixes the quantity of money supplied at $2.5 billion.
Use the orange line (square symbol) to plot the initial money supply (MS1MS1) set by the Fed. Then, referring to the previous table, use the blue connected points (circle symbol) to graph the money demand curve.
According to your graph, the equilibrium value of money is ______ , therefore the equilibrium price level is _____
Now, suppose that the Fed increases the money supply from the initial level of $2.5 billion to $4 billion.
In order to increase the money supply, the Fed can use open market operations to _____ (sell bonds to/buy bonds from) the public.
Use the purple line (diamond symbol) to plot the new money supply (MS2MS2).
Immediately after the Fed changes the money supply from its initial equilibrium level, the quantity of money supplied is ____ (greater/less) than the quantity of money demanded at the initial equilibrium. This expansion in the money supply will ______ (increase/reduce) people's demand for goods and services. In the long run, since the economy's ability to produce goods and services has not changed, the prices of goods and services will _____ (rise/fall) and the value of money will _____ (rise/fall) .
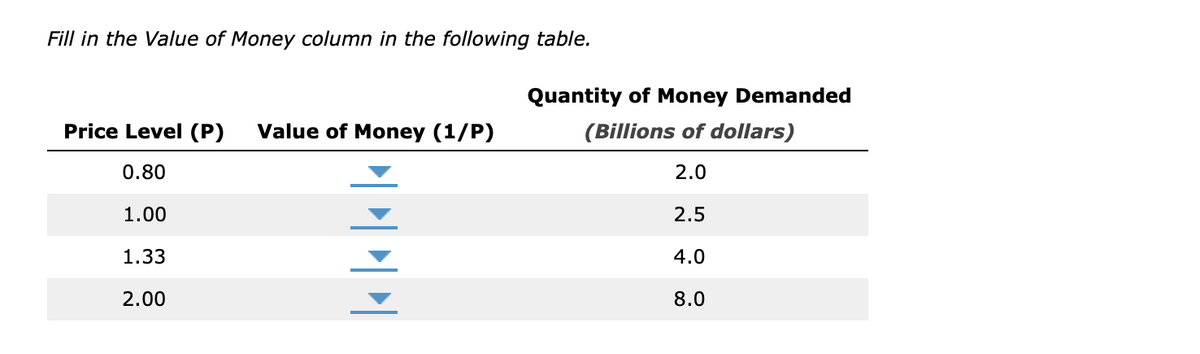
Transcribed Image Text:Fill in the Value of Money column in the following table.
Price Level (P) Value of Money (1/P)
0.80
1.00
1.33
2.00
|||||
Quantity of Money Demanded
(Billions of dollars)
2.0
2.5
4.0
8.0
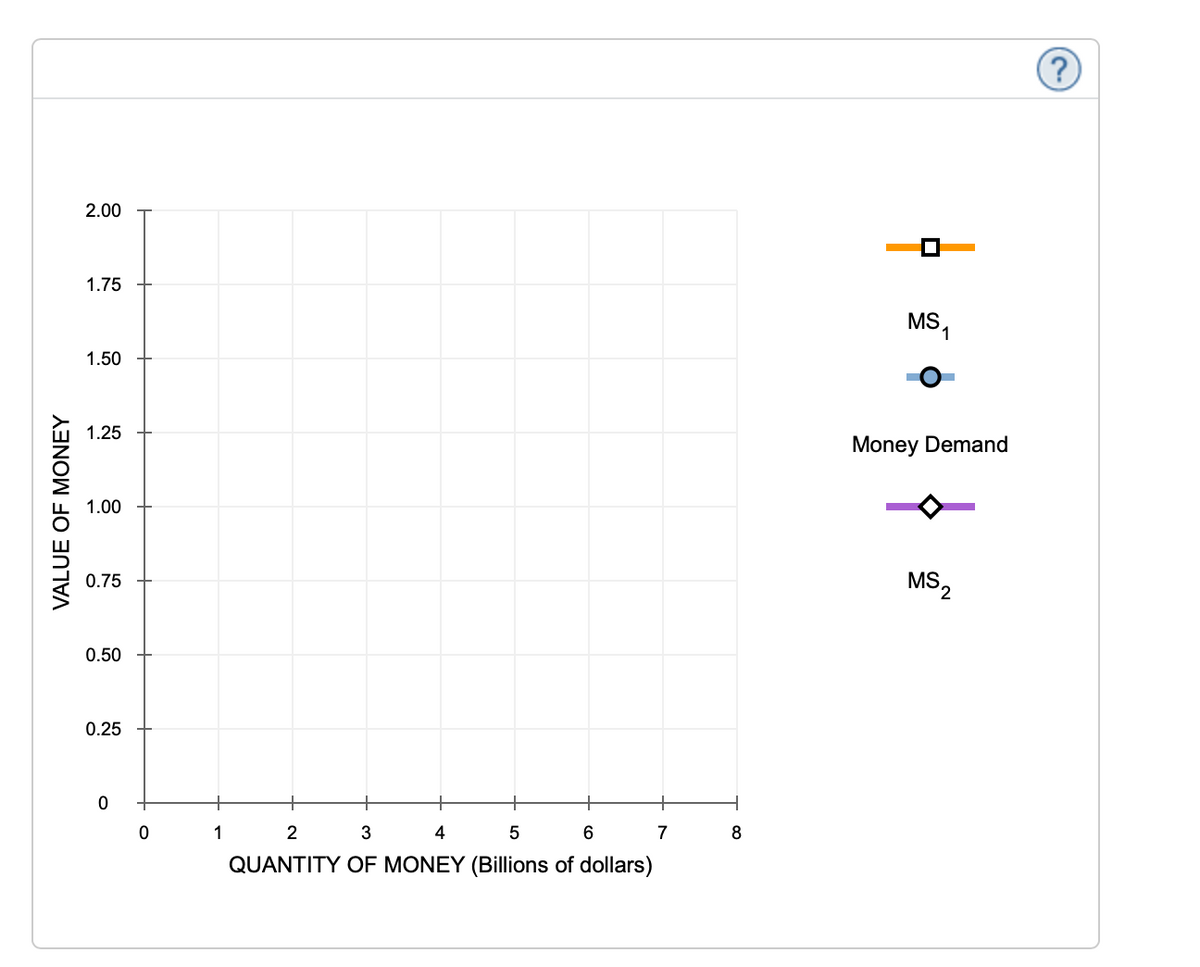
Transcribed Image Text:VALUE OF MONEY
2.00
1.75
1.50
1.25
1.00
0.75
0.50
0.25
0
0
1
2
3
4
5
6
QUANTITY OF MONEY (Billions of dollars)
7
8
MS
1
Money Demand
MS2
?
Expert Solution
This question has been solved!
Explore an expertly crafted, step-by-step solution for a thorough understanding of key concepts.

This is a popular solution!

Trending now
This is a popular solution!

Step by step
Solved in 3 steps with 1 images

Knowledge Booster


Learn more about
Need a deep-dive on the concept behind this application? Look no further. Learn more about this topic, economics and related others by exploring similar questions and additional content below.Recommended textbooks for you


Economics (MindTap Course List)
Economics
ISBN:
9781337617383
Author:
Roger A. Arnold
Publisher:
Cengage Learning
