The following table shows average Canadian gas prices, per litre, from 1979 to 2007. Year 1979 1983 1987 1991 1996 2001 2003 2007 Years Since 4 12 17 22 24 28 1979 Price (C/L) 21.98 45.92 47.95 57.05 58.52 70.56 74.48 102.27 After performing a cubic regression, the leading coefficient, rounded to the nearest thousandth (three decimal places), is, Using the cubic regression function rounded to the nearest thouşandth for the data above, determine the cost of gasoline in 1990. State your answer to the nearest tenth of a cent.
The following table shows average Canadian gas prices, per litre, from 1979 to 2007. Year 1979 1983 1987 1991 1996 2001 2003 2007 Years Since 4 12 17 22 24 28 1979 Price (C/L) 21.98 45.92 47.95 57.05 58.52 70.56 74.48 102.27 After performing a cubic regression, the leading coefficient, rounded to the nearest thousandth (three decimal places), is, Using the cubic regression function rounded to the nearest thouşandth for the data above, determine the cost of gasoline in 1990. State your answer to the nearest tenth of a cent.

Glencoe Algebra 1, Student Edition, 9780079039897, 0079039898, 2018
18th Edition
ISBN:9780079039897
Author:Carter
Publisher:Carter
Chapter4: Equations Of Linear Functions
Section4.6: Regression And Median-fit Lines
Problem 4GP

Related questions
Question
5
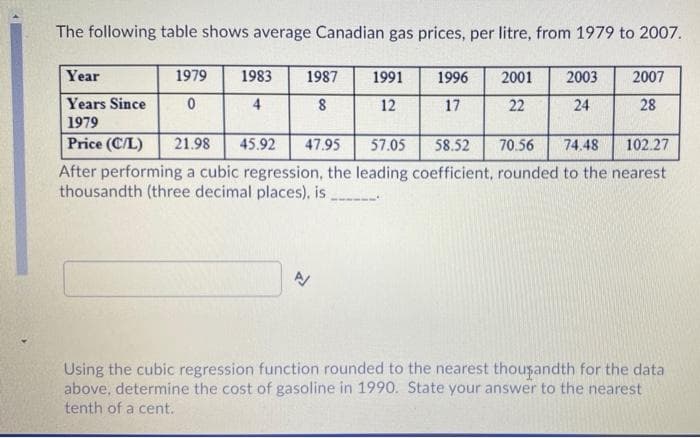
Transcribed Image Text:The following table shows average Canadian gas prices, per litre, from 1979 to 2007.
Year
1979
1983
1987
1991
1996
2001
2003
2007
Years Since
4
12
17
22
24
28
1979
Price (C/L)
21.98
45.92
47.95
57.05
58.52
70.56
74.48
102.27
After performing a cubic regression, the leading coefficient, rounded to the nearest
thousandth (three decimal places), is
Using the cubic regression function rounded to the nearest thousandth for the data
above, determine the cost of gasoline in 1990. State your answer to the nearest
tenth of a cent.
Expert Solution
This question has been solved!
Explore an expertly crafted, step-by-step solution for a thorough understanding of key concepts.

Step by step
Solved in 2 steps with 1 images

Recommended textbooks for you
Glencoe Algebra 1, Student Edition, 9780079039897…
Algebra
ISBN:
9780079039897
Author:
Carter
Publisher:
McGraw Hill

College Algebra
Algebra
ISBN:
9781305115545
Author:
James Stewart, Lothar Redlin, Saleem Watson
Publisher:
Cengage Learning
Glencoe Algebra 1, Student Edition, 9780079039897…
Algebra
ISBN:
9780079039897
Author:
Carter
Publisher:
McGraw Hill
College Algebra
Algebra
ISBN:
9781305115545
Author:
James Stewart, Lothar Redlin, Saleem Watson
Publisher:
Cengage Learning