The following table shows fuel consumption in billions of gallons of all vehicles in the U.S. for years since 1990. Year 0 3 175+ 170- 165- 160- 155- 150- Let F(t) be the fuel consumption in billions of gallons in t years since 1990. A quadratic model for the data is F(t) = -0.114t2 +4.62t + 127.598. & G 145 6 9 140 12 15 18 Fuel Use 130.8 137.3 147.4 161.4 168.7 174.8 170.8 135- 130 1254 is de Use the above scatter plot to decide whether the quadratic model fits the data well. The function is a good model for the data. The function is not a good model for the data Estimate the fuel consumption in the U. S. in 2015. billions of gallons. Use the model to predict the year in which U.S. fuel consumption will peak.
The following table shows fuel consumption in billions of gallons of all vehicles in the U.S. for years since 1990. Year 0 3 175+ 170- 165- 160- 155- 150- Let F(t) be the fuel consumption in billions of gallons in t years since 1990. A quadratic model for the data is F(t) = -0.114t2 +4.62t + 127.598. & G 145 6 9 140 12 15 18 Fuel Use 130.8 137.3 147.4 161.4 168.7 174.8 170.8 135- 130 1254 is de Use the above scatter plot to decide whether the quadratic model fits the data well. The function is a good model for the data. The function is not a good model for the data Estimate the fuel consumption in the U. S. in 2015. billions of gallons. Use the model to predict the year in which U.S. fuel consumption will peak.

Algebra & Trigonometry with Analytic Geometry
13th Edition
ISBN:9781133382119
Author:Swokowski
Publisher:Swokowski
Chapter7: Analytic Trigonometry
Section7.6: The Inverse Trigonometric Functions
Problem 91E

Related questions
Question
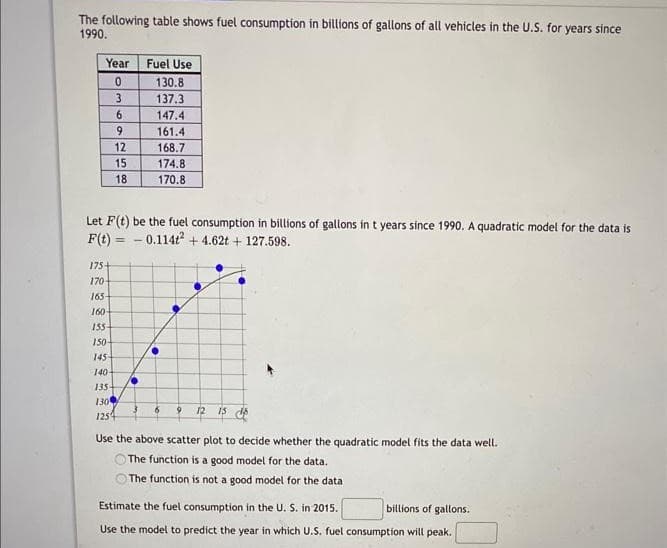
Transcribed Image Text:The following table shows fuel consumption in billions of gallons of all vehicles in the U.S. for years since
1990.
Year
0
3
6
9
12
15
18
175+
170-
165-
160-
155-
150-
145
140-
Fuel Use
130.8
137.3
147.4
Let F(t) be the fuel consumption in billions of gallons in t years since 1990. A quadratic model for the data is
0.114t2 + 4.62t + 127.598.
F(t)
=
135-
130
1254
161.4
168.7
174.8
170.8
6
12
Use the above scatter plot to decide whether the quadratic model fits the data well.
The function is a good model for the data.
The function is not a good model for the data
Estimate the fuel consumption in the U. S. in 2015.
billions of gallons.
Use the model to predict the year in which U.S. fuel consumption will peak.
Expert Solution
This question has been solved!
Explore an expertly crafted, step-by-step solution for a thorough understanding of key concepts.

This is a popular solution!

Trending now
This is a popular solution!

Step by step
Solved in 2 steps with 2 images

Recommended textbooks for you
Algebra & Trigonometry with Analytic Geometry
Algebra
ISBN:
9781133382119
Author:
Swokowski
Publisher:
Cengage

College Algebra (MindTap Course List)
Algebra
ISBN:
9781305652231
Author:
R. David Gustafson, Jeff Hughes
Publisher:
Cengage Learning

Algebra & Trigonometry with Analytic Geometry
Algebra
ISBN:
9781133382119
Author:
Swokowski
Publisher:
Cengage
College Algebra (MindTap Course List)
Algebra
ISBN:
9781305652231
Author:
R. David Gustafson, Jeff Hughes
Publisher:
Cengage Learning

Algebra: Structure And Method, Book 1
Algebra
ISBN:
9780395977224
Author:
Richard G. Brown, Mary P. Dolciani, Robert H. Sorgenfrey, William L. Cole
Publisher:
McDougal Littell

College Algebra
Algebra
ISBN:
9781305115545
Author:
James Stewart, Lothar Redlin, Saleem Watson
Publisher:
Cengage Learning

Algebra and Trigonometry (MindTap Course List)
Algebra
ISBN:
9781305071742
Author:
James Stewart, Lothar Redlin, Saleem Watson
Publisher:
Cengage Learning