The following table shows retail sales in drug stores in billions of dollars in the U.S. for years since 1995. Year Retail Sales 0 85.851 3 108.426 6 141.781 9 169.256 12 202.297 15 222.266 Let S(t) be the retails sales in billions of dollars in t years since 1995. A linear model for the data is F(t) 9.44t+84.182. 220- 210 200 190- 180- 170 160- 150- 140- 130- 120 110- 100 90- 12 804 Use the above scatter plot to decide whether the linear model fits the data well. The function is a good model for the data. The function is not a good model for the data Estimate the retails sales in the U. S. in 2011. billions of dollars. Use the model to predict the year in which retails sales will be $248 billion.
The following table shows retail sales in drug stores in billions of dollars in the U.S. for years since 1995. Year Retail Sales 0 85.851 3 108.426 6 141.781 9 169.256 12 202.297 15 222.266 Let S(t) be the retails sales in billions of dollars in t years since 1995. A linear model for the data is F(t) 9.44t+84.182. 220- 210 200 190- 180- 170 160- 150- 140- 130- 120 110- 100 90- 12 804 Use the above scatter plot to decide whether the linear model fits the data well. The function is a good model for the data. The function is not a good model for the data Estimate the retails sales in the U. S. in 2011. billions of dollars. Use the model to predict the year in which retails sales will be $248 billion.

Chapter18: The Management Of Accounts Receivable And Inventories
Section: Chapter Questions
Problem 1P

Related questions
Question
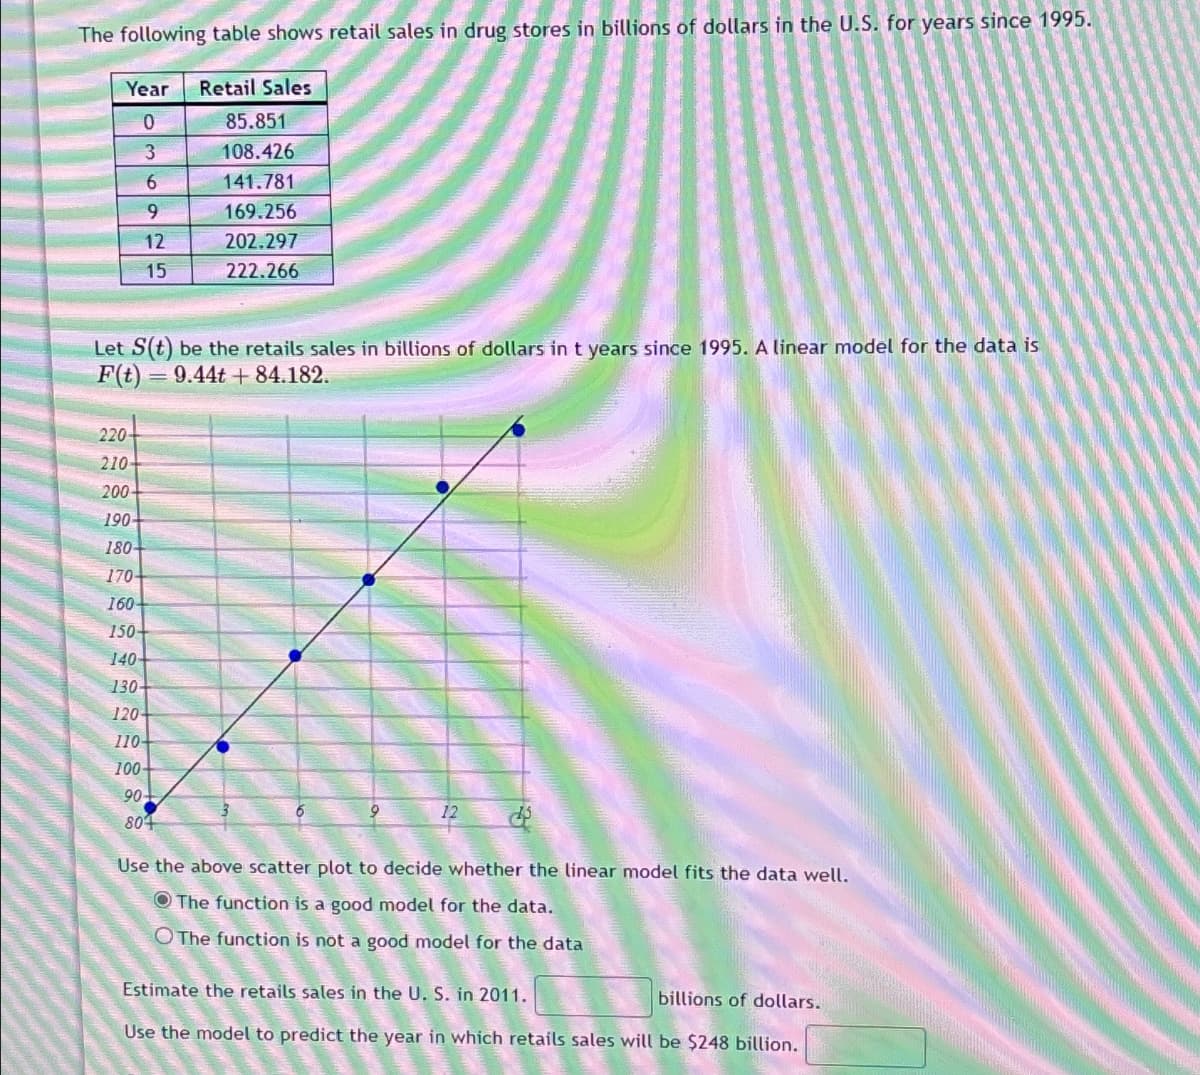
Transcribed Image Text:The following table shows retail sales in drug stores in billions of dollars in the U.S. for years since 1995.
Year Retail Sales
0
85.851
3
108.426
6
141.781
9
169.256
12
202.297
15
222.266
Let S(t) be the retails sales in billions of dollars in t years since 1995. A linear model for the data is
F(t) 9.44t+84.182.
220-
210
200
190-
180-
170
160-
150-
140-
130-
120
110-
100
90-
12
804
Use the above scatter plot to decide whether the linear model fits the data well.
The function is a good model for the data.
The function is not a good model for the data
Estimate the retails sales in the U. S. in 2011.
billions of dollars.
Use the model to predict the year in which retails sales will be $248 billion.
Expert Solution
This question has been solved!
Explore an expertly crafted, step-by-step solution for a thorough understanding of key concepts.

This is a popular solution!

Trending now
This is a popular solution!

Step by step
Solved in 2 steps with 1 images

Recommended textbooks for you
EBK CONTEMPORARY FINANCIAL MANAGEMENT
Finance
ISBN:
9781337514835
Author:
MOYER
Publisher:
CENGAGE LEARNING - CONSIGNMENT

Essentials of Business Analytics (MindTap Course …
Statistics
ISBN:
9781305627734
Author:
Jeffrey D. Camm, James J. Cochran, Michael J. Fry, Jeffrey W. Ohlmann, David R. Anderson
Publisher:
Cengage Learning

College Accounting (Book Only): A Career Approach
Accounting
ISBN:
9781305084087
Author:
Cathy J. Scott
Publisher:
Cengage Learning
EBK CONTEMPORARY FINANCIAL MANAGEMENT
Finance
ISBN:
9781337514835
Author:
MOYER
Publisher:
CENGAGE LEARNING - CONSIGNMENT
Essentials of Business Analytics (MindTap Course …
Statistics
ISBN:
9781305627734
Author:
Jeffrey D. Camm, James J. Cochran, Michael J. Fry, Jeffrey W. Ohlmann, David R. Anderson
Publisher:
Cengage Learning
College Accounting (Book Only): A Career Approach
Accounting
ISBN:
9781305084087
Author:
Cathy J. Scott
Publisher:
Cengage Learning

Intermediate Financial Management (MindTap Course…
Finance
ISBN:
9781337395083
Author:
Eugene F. Brigham, Phillip R. Daves
Publisher:
Cengage Learning

Managerial Accounting
Accounting
ISBN:
9781337912020
Author:
Carl Warren, Ph.d. Cma William B. Tayler
Publisher:
South-Western College Pub

Intermediate Accounting: Reporting And Analysis
Accounting
ISBN:
9781337788281
Author:
James M. Wahlen, Jefferson P. Jones, Donald Pagach
Publisher:
Cengage Learning