The following table shows retail sales in drug stores in billions of dollars in the U.S. for years since 1995. 220 210- 200- 190- 180 170- 160- 150- 140- 130- 120 110- 100 90 Year Retail Sales 0 3 6 9 12 15 Let S(t) be the retails sales in billions of dollars in t years since 1995. A linear model for the data is F(t) = 9.44t + 84.182. 80+ 85.851 108.426 141.781 169.256 202.297 222.266 3 6 9 12 15 Use the above scatter plot to decide whether the linear model fits the data well. The function is a good model for the data. The function is not a good model for the data Estimate the retails sales in the U. S. in 2015. billions of dollars.
The following table shows retail sales in drug stores in billions of dollars in the U.S. for years since 1995. 220 210- 200- 190- 180 170- 160- 150- 140- 130- 120 110- 100 90 Year Retail Sales 0 3 6 9 12 15 Let S(t) be the retails sales in billions of dollars in t years since 1995. A linear model for the data is F(t) = 9.44t + 84.182. 80+ 85.851 108.426 141.781 169.256 202.297 222.266 3 6 9 12 15 Use the above scatter plot to decide whether the linear model fits the data well. The function is a good model for the data. The function is not a good model for the data Estimate the retails sales in the U. S. in 2015. billions of dollars.

Chapter3: Polynomial Functions
Section3.5: Mathematical Modeling And Variation
Problem 1ECP: The ordered pairs below give the median sales prices y (in thousands of dollars) of new homes sold...

Related questions
Question
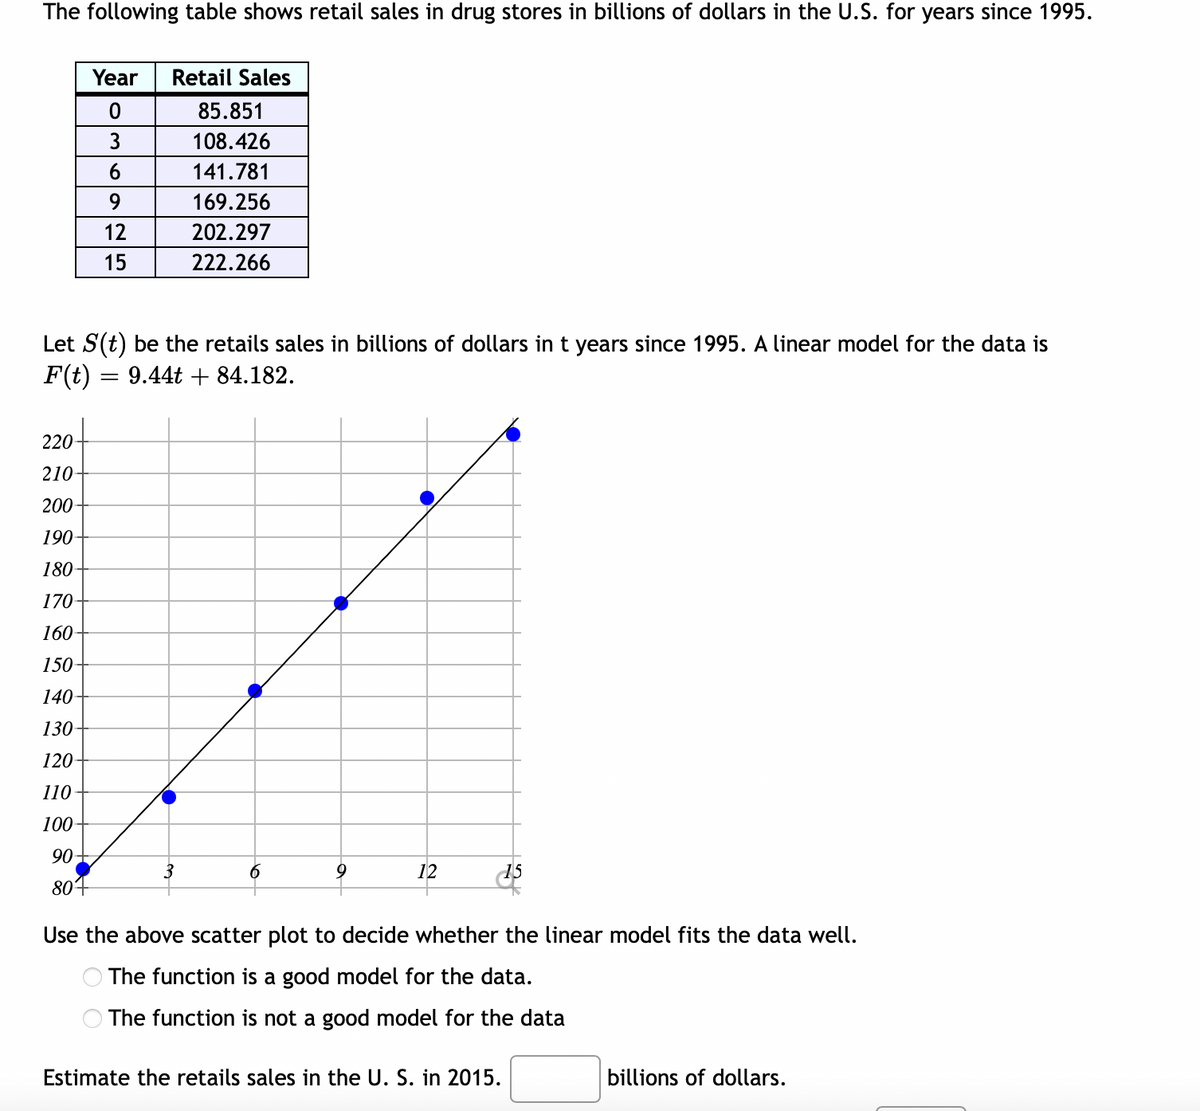
Transcribed Image Text:The following table shows retail sales in drug stores in billions of dollars in the U.S. for years since 1995.
220-
210
200
190
180
170
160
150
Year
0
130-
120-
110-
100-
90
801
6
12
15
Let S(t) be the retails sales in billions of dollars in t years since 1995. A linear model for the data is
F(t) = 9.44t + 84.182.
Retail Sales
85.851
108.426
141.781
169.256
202.297
222.266
3
6
9
12
15
Use the above scatter plot to decide whether the linear model fits the data well.
The function is a good model for the data.
The function is not a good model for the data
Estimate the retails sales in the U. S. in 2015.
billions of dollars.
Transcribed Image Text:Use the above scatter plot to decide whether the linear model fits the data well.
The function is a good model for the data.
The function is not a good model for the data
Estimate the retails sales in the U. S. in 2015.
billions of dollars.
Use the model to predict the year that corresponds to retails sales of $244 billion.
Expert Solution
This question has been solved!
Explore an expertly crafted, step-by-step solution for a thorough understanding of key concepts.

Step by step
Solved in 2 steps with 1 images

Recommended textbooks for you

Algebra & Trigonometry with Analytic Geometry
Algebra
ISBN:
9781133382119
Author:
Swokowski
Publisher:
Cengage
Algebra & Trigonometry with Analytic Geometry
Algebra
ISBN:
9781133382119
Author:
Swokowski
Publisher:
Cengage