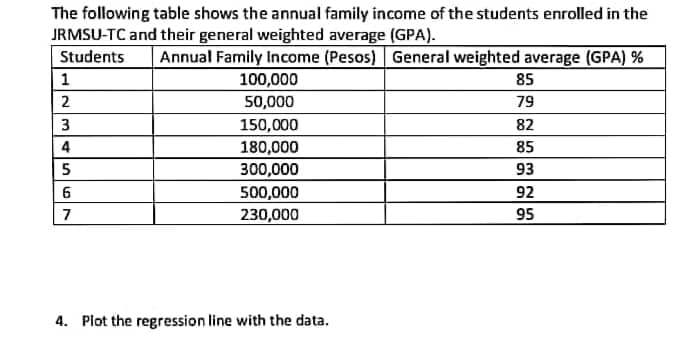
The following table shows the annual family income of the students enrolled in the JRMSU-TC and their general weighted average (GPA). Students Annual Family Income (Pesos) General weighted average (GPA) % 1 85 100,000 50,000 2 79 3 150,000 82 180,000 85 300,000 93 500,000 92 230,000 95 4567


Q: The British government conducts regular surveys of household spending. The average weekly household…
A: From the given Scatter plot Select the correct choice
Q: Question 3 A sample of 44 commuters in Chicago showed the average of the commuting times was 33.2…
A: "Since you have asked multiple questions, we'll solve the first question for you. If you want any…
Q: Authors of a computer algebra system wish to compare the speed of a new computational algorithm to…
A: Solution
Q: The weights (in ounces) of 3 types of women's shoes are shown below. At 5% level of significance,…
A: Given information: Variable of interest= Shoe type Types of shoes=1.Dress heels 2. Dress flats…
Q: B. Determine the sample size, given the following data: (s sample standard. de 1. s= 5, E = 2.45, E…
A: Hello! As you have posted 5 different questions, we are answering the first question. In case you…
Q: STATISTICS AND PROBABILITY (Answer only. NO long explanation needed. Rate will be given) ANSWER IN…
A:
Q: 48. Raquel noticed that the higher number of members in the family living together corresponds to…
A: Given problema related to correlation and regression. We have to choose the correct option in each…
Q: Test 1: Multiple Linear Regression. Given the following data: y X1 X2 X3 X4 X5 x6 8.0 19.6 94.9 2.3…
A: Note: As per guidelines we will solve the first question only, please repost other questions for…
Q: > Find the indicated z-scores shown in the graph. Click to view page 1 of the Standard Normal Table…
A:
Q: Six girls and five boys wish to join a ski trip. Four of them will be selected at random. What is…
A: Six girls and five boys wish to join a ski trip. Four of them will be selected at random. What is…
Q: Four different washing solutions are being compared to study their effectiveness in retarding bacter…
A: Chi-Square Test: The Chi-square test of independence determines whether or not two variables are…
Q: Question 3 A sample of 44 commuters in Chicago showed the average of the commuting times was 33.2…
A: The following information has been given: The sample size is n=44. The sample mean is x¯=33.2. The…
Q: Testing Hypothesis A company that makes cola drinks states that the mean caffeine content per 12-…
A:
Q: For regress problems how do you find the R squared Value? Regress Y on X1, X2, X3, X4 and X5
A: Y on X1, X2, X3, X4, X5 is model of multiple regression. Here model will be framed as multiple…
Q: 1. Let X be an RV with PDF - f(x) = {1 = |x| a. Find the mean of g(x) = 5x² - 1. b. Find the…
A:
Q: The daily sales at a convenience store produce a normal distribution with a mean of $1,990 and a…
A: Given problem is normal distribution. Let, X: daily sales at a convenience store product μ=mean=1990…
Q: Quarter 4: Performance Task The following are scores of random Grade 10 learners in a 1 Science Math…
A: Question 2 For Science subject : sample size (n) = 7 sample mean (x̄) = Σx/n = 549/7 = 78.43…
Q: The scores for a Prestatistics exam are given: 90 79 73 61 76 93 33 87 15 49 87 36 Construct a…
A: Solution-: Given data: 90, 79, 73, 61, 76, 93, 33, 87, 15, 49, 87, 36 Construct a frequency table…
Q: What will happen to the length of the interval estimate if we have increase the confidence level say…
A: Given : Situation : Increase the confidence level say from 90% to 95% interval
Q: In a random sample of 60 workers the average time taken by them to get to work is 33.8 minutes with…
A: Given : Sample size (n) = 60 Sample mean (X¯) = 33.8 Standard deviation (S) = 6.1 Significance level…
Q: A sample is selected from a normal population, and resulting data are as follows: 45.2, 51.5, 49.4,…
A: Given: Sample size n = 6 Significance level α = 0.05 Formula Used: Test-statistic t = X-μSn
Q: A random sample of 400 men from one stage gives the mean pay of Rs. 200 per day with a standard…
A: To find: 99% confidence interval for difference in means.
Q: Records of the past 15 years have shown the average revenue of company A for the month of March to…
A: Introduction: Denote μ1, μ2 as the true average revenues (M pesos) of Companies A and B,…
Q: Suppose that the time spent by children under the age of 12 in front of a screen per year has the…
A: 1. The provided information is µ=1500 σ=250 n=12…
Q: A high school teacher at a small private school assigns trigonometry practice problems to be worked…
A: For the given data Find a. Sample Mean in Minutes? b. Error in Minutes? c. Confidence Interval:…
Q: 5. In this graph, which material is the cheapest? Teddy Bear Materials Cost Thread Buttons Polyester…
A: 5. The above graph is material vs cost per bear. We clearly seen the cost of fur fabric is higher…
Q: In an attempt to assess the effect of the student's score in the admission test to their academic…
A: The provided information is Sore in admission test x Grade y xy x2 52 80 4160 2704 61 78…
Q: A genetics institute conducted clinical trials of a fertility method designed to increase the…
A: Among 152 babies born; n=152 Using the fertility method 123 were boys; x=123 95% confidence…
Q: Per the following graph, explain the reason for every statistic that is calculated. For…
A: For the male cases, Mean=1124 Median=1129 Mode: 311, 281, 291, 1868, 2008, 1980, 1129. The average…
Q: An oil company conducts a geological study that indicates that an exploratory oil well should have a…
A: Geometric distribution: The probability mass function of Geometric distribution is P(n) = p(1 - p)n…
Q: onent. Determine the moment exerted about the steering column at O.
A:
Q: The geyser Old Faithful in Yellowstone National Park alternates periods of eruption, which typically…
A: Solution-: Given: Class width =5 and use 55 as the lower class limit for the first class We want to…
Q: Below is a scatterplot of the number of home runs versus the number of stolen bases for major league…
A: The scatterplot shows the number of home runs versus the number of stolen bases for major league…
Q: houldn't 100-1.57 be 98.43? How did you get 96.88? Thanks,
A:
Q: B. Test the significance of r. Steps: 1:Ho:P=0( Ha:P#0 2: Level of significance: a =_ 3: Test…
A: IQ Statistics 1 65 85 2 50 74 3 55 7 4 65 90 5 70 85 6 65 87 7 70 94 8 55 85 9…
Q: Find the proportion of Normally distributed observations with a z-score above 0.80. Give your answer…
A:
Q: Test 1: Multiple Linear Regression. Given the following data: y x1 X2 X3 X4 8.0 19.6 94.9 2.3 5.2…
A: y x1 x2 x3 x4 x5 x6 8 19.6 94.9 2.3 5.2 29.60 2.1 8.3 19.8 89.7 1.8 5.2 32.40 2.1 8.5 19.6…
Q: 1.The National Academy of Science reported that 45% of research in mathematics is published by US…
A:
Q: 3. The following data shows the results of 4 students in a 50-item multiple choice exam: 47, 36, 42,…
A: The provided information is x x2 47 2209 36 1296 42 1764 35 1225
Q: A government's department of transportation requires tire manufacturers to provide performance…
A: Given Xbar=195.6 Standard deviation (s)=21.4 Sample size n=18 Assume Alpha=0.01
Q: STATISTICS AND PROBABILITY (Answer only. NO long explanation needed. Rate will be given) a. Find…
A:
Q: Analysis of Mercury in Fish Trial verage td. Dev. Relative Std. Dev. 6 Relative Standard Deviation 1…
A: Given : Trial ppb (Hg) 1 5.4 2 2.9 3 5.1 4 4.2 5 5.6 6 4.7 7 7.9 8 4.8 9 7.6…
Q: ollowing are the numbers of hospitals in each of the 50 U.S. states plus the District of Columbia…
A: Solution To find the dot plot arrange the data in order.
Q: The time spent commuting from home to work for all employees at a very large company has a normal…
A: Solution
Q: QUESTION 7 Consider an industry with two products A and B. There are 100 consumers who value product…
A:
Q: Construct a relative frequency distribution. Round the answers to two decimal places. Response…
A:
Q: Question 7 For the following information x 43 48 56 61 128 120 y 135 143 (a) Estimate the sample…
A: Note: As per guidelines we are supposed to solve only first three subparts. Please repost the other…
Q: ) The diameters of bolts produced by a certain machine are normally distribut a mean of 0.30 inches…
A: The provided information is µ=0.30 σ=0.01 n=2…
Q: The relationship between confidence interval and hypothesis testing is very close. Do you agree?…
A: Note: As per the guidelines if multiple questions are posted only first question should be answered.…
Q: Question 4 A manager of Kalundu supermarket claims that the average weight of loaves of bread they…
A: Given: Population mean μ = 400 Sample size n = 50 Sample standard deviation s = 25 Formula Used: Z…

Step by step
Solved in 2 steps with 1 images

- Olympic Pole Vault The graph in Figure 7 indicates that in recent years the winning Olympic men’s pole vault height has fallen below the value predicted by the regression line in Example 2. This might have occurred because when the pole vault was a new event there was much room for improvement in vaulters’ performances, whereas now even the best training can produce only incremental advances. Let’s see whether concentrating on more recent results gives a better predictor of future records. (a) Use the data in Table 2 (page 176) to complete the table of winning pole vault heights shown in the margin. (Note that we are using x=0 to correspond to the year 1972, where this restricted data set begins.) (b) Find the regression line for the data in part ‚(a). (c) Plot the data and the regression line on the same axes. Does the regression line seem to provide a good model for the data? (d) What does the regression line predict as the winning pole vault height for the 2012 Olympics? Compare this predicted value to the actual 2012 winning height of 5.97 m, as described on page 177. Has this new regression line provided a better prediction than the line in Example 2?A random sample of non-industrialized countries was selected and the life expectancy in years is listed for both men and women. Given that the correlation coefficient is significant. Find the equation of the regression line men,x :59.7, 72.9,41.9,46.2,50.3,43.2 Women,y :63.8,77.8,44.5,48.3,54.0,43.5The following table gives the data for the grades on the midterm exam and the grades on the final exam. Determine the equation of the regression line, yˆ=b0+b1x�^=�0+�1�. Round the slope and y-intercept to the nearest thousandth. Grades on Midterm and Final Exams Grades on Midterm 7171 6262 7878 9494 8383 8181 8080 9494 8585 6262 Grades on Final 8888 7979 8888 9191 8080 7070 7171 9393 6565 7777
- The Update to the Task Force Report on Blood Pressure Control in Children [12] reported the observed 90th per-centile of SBP in single years of age from age 1 to 17 based on prior studies. The data for boys of average height are given in Table 11.18. Suppose we seek a more efficient way to display the data and choose linear regression to accomplish this task. age sbp 1 99 2 102 3 105 4 107 5 108 6 110 7 111 8 112 9 114 10 115 11 117 12 120 13 122 14 125 15 127 16 130 17 132 Do you think the linear regression provides a good fit to the data? Why or why not? Use residual analysis to justify your answer. Am I supposed to run a residual plot and QQ-plot for this question?Interpret the estimated regression coefficient corresponding to the Z variable. Data Salary Education Experience Sex 29.7985 15 3 1 21.8219 4 0 0 22.8978 4 0 0 22.0917 1 1 0 21.8993 5 0 0 22.4829 3 1 1 28.0772 15 0 0 y=salary 23.6292 6 1 1 x1=education level in schooling years 32.3595 0 15 1 x2=experience level in employment level 21.794 1 0 0 d=sex (1 for male,0 for female) 19.8762 3 0 0 Ln(Y) = alpha +beta1X1 +Beta2X2+ Beta3D +Beta4Z +e 21.0253 3 0 0 where z =X2D 24.6323 0 5 1 19.0247 0 0 0 18.8857 0 0 0 21.8552 1 0 0 24.2675 6 1 0 18.7931 0 0 0 18.9276 0 0 0 23.4441 5 1 1 20.8047 2 0 0 18.26 0 0 0 20.6726 0 2 1 21.7815 3 0 0…The following table shows the starting salary and profile of a sample of 10 employees in a certain call center agency. Run a multiple regression analysis with starting salary as the dependent variable (pesos) and GPA, years of experience and civil service ratings as the independent variables. Use .05 level of significance.What is the equation of the resulting multiple linear regression? starting_salary = 3008.61 + 48.65*GPA + 94.79*years_of_experience + 27.36*civil_service_ratings starting_salary = 15000.00 + 48.65*GPA + 94.79*years_of_experience + 27.36*civil_service_ratings starting_salary = 15001.00 + 41.43*GPA + 84.71*years_of_experience + 37.32*civil_service_ratings starting_salary = 2366.77 + 130.25*GPA + 396.39*years_of_experience + 21.67*civil_service_ratings
- For these (x,y) pairs of data points: 1,5 3,7 4,6 5,8 7,9 Compute . Compute . What is the equation of the regression line?A research department of an American automobile company wants to develop a model topredict gasoline mileage (measured in MPG) of the company’s vehicles by using theirhorsepower and weights (measured in pounds). To do this, it took a random sample of 50vehicles to perform a regression analysis as follows: SUMMARYOUTPUTRegression StatisticsMultiple R 0.865689R Square 0.749417Adjusted RSquare 0.738754Standard Error 4.176602Observations 50ANOVAdf SS MS FRegression a 2451.973702 1225.987 dResidual b 819.8680976 cTotal 49 3271.8418CoefficientsStandardError t StatIntercept 58.15708 2.658248208 21.87797Horsepower -0.11753 0.032643428 -3.60028Weight -0.00687 0.001401173 -4.90349(a) State the multiple regression equation. Interpret the meanings of the coefficients forhorsepower and weight.(b) Test the validity of this multiple regression equation at the significance level of 1%. Showyour reasoning.(c) The research department claims that the weight of the vehicle is negatively linearly related…The following table gives the data for the average temperature and the snow accumulation in several small towns for a single month. Determine the equation of the regression line, yˆ=b0+b1x�^=�0+�1�. Round the slope and y-intercept to the nearest thousandth. Then determine if the regression equation is appropriate for making predictions at the 0.050.05 level of significance. Critical Values of the Pearson Correlation Coefficient Average Temperatures and Snow Accumulations Average Temperature (℉℉) 3939 2525 1515 4242 4242 2424 3232 2020 3030 3737 Snow Accumulation (in.in.) 66 1515 2929 66 1414 2626 2323 1212 1616 77 Copy Data Regression equation: yˆ=�^= Is the equation appropriate? Yes
- Suppose a researcher collects data on houses that have been sold in a particular neighbourhood over the past year, and obtains the regressions results in the table shown below. A family purchases a 2000 square foot home and plans to make extensions totalling 500 square feet. The house currently has a pool, and a real estate agent has reported that the house is in excellent condition. However, the house does not have a view, and this will not change as a result of the extensions. According to the results in column (1), what is the expected DOLLAR increase in the price of the home due to the planned extensions?The number of initial public offerings of stock issued in a 10-year period and the total proceeds of these offerings (in millions) are shown in the table. Construct and interpret a 95% prediction interval for the proceeds when the number of issues is 569.The equation of the regression line is y=32.409x+17,285.501. Issues, x 410 467 679 499 497 394 62 53 189 174 Proceeds, y 18,223 28,066 43,757 31,337 35,488 35,312 22,180 10,660 30,384 28,416 Construct and interpret a 95% prediction interval for the proceeds when the number of issues is 569. Select the correct choice below and fill in the answer boxes to complete your choice. (Round to the nearest million dollars as needed. Type your answer in standard form where "3.12 million" means 3,120,000.) A. There is a 95% chance that the predicted proceeds given 569 issues is between $____ and $____. B. We can be 95% confident…The table below shows the numbers of new-vehicle sales (in thousands) for Company 1 and Company 2 for 11 years. Construct and interpret a 99% prediction interval for new-vehicle sales for Company 2 when the number of new vehicles sold by Company 1 is 2600 thousand. The equation of the regression line is y=1.228x+331.966 Company_1,_x Company_2,_y4093 49293976 48203557 48003411 47323296 46193102 44872859 40482488 38091970 29191625 20021946 2176 Construct and interpret a 99% prediction interval for new-vehicle sales for Company 2 when the number of new vehicles sold by Company 1 is 2600 thousand. Select the correct choice below and fill in the answer boxes to complete your choice. (Round to the nearest cent as needed.) A. There is a 99% chance that the predicted new-vehicle sales for Company 2 is between enter your response here and enter your response here thousand, given that the new-vehicle sales for Company 1 is 2600 thousand.…

