The following table shows the daily receipts in millions of dollars of the movie "The Hunger Games" after its opening on 23 March 2012. Days SReceipts 33.111 14 28 14.666 5.587 2.95 42 56 70 1.567 84 0.852 98 0.397 112 0.279 126 0.518 Find the average rate of change of the daily receipts from day 70 to day 126. Preview millions / day
The following table shows the daily receipts in millions of dollars of the movie "The Hunger Games" after its opening on 23 March 2012. Days SReceipts 33.111 14 28 14.666 5.587 2.95 42 56 70 1.567 84 0.852 98 0.397 112 0.279 126 0.518 Find the average rate of change of the daily receipts from day 70 to day 126. Preview millions / day

Chapter12: Sequences, Series And Binomial Theorem
Section12.3: Geometric Sequences And Series
Problem 12.58TI: What is the total effect on the economy of a government tax rebate of $500 to each household in...

Related questions
Question
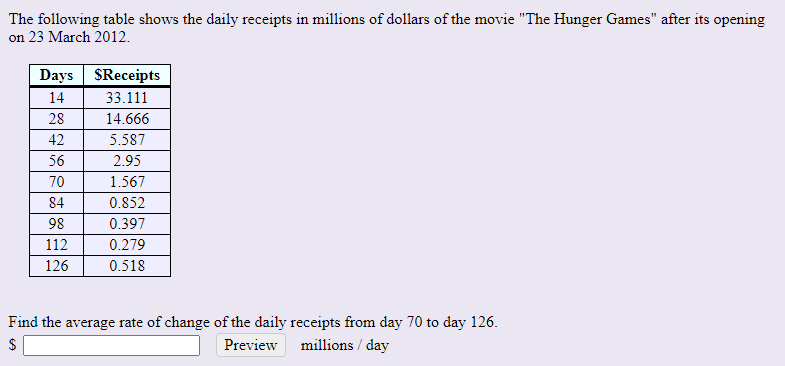
Transcribed Image Text:The following table shows the daily receipts in millions of dollars of the movie "The Hunger Games" after its opening
on 23 March 2012.
Days SReceipts
14
33.111
28
14.666
42
5.587
56
2.95
70
1.567
84
0.852
98
0.397
112
0.279
126
0.518
Find the average rate of change of the daily receipts from day 70 to day 126.
Preview
millions / day
Expert Solution
This question has been solved!
Explore an expertly crafted, step-by-step solution for a thorough understanding of key concepts.

This is a popular solution!

Trending now
This is a popular solution!

Step by step
Solved in 2 steps with 2 images

Recommended textbooks for you

Glencoe Algebra 1, Student Edition, 9780079039897…
Algebra
ISBN:
9780079039897
Author:
Carter
Publisher:
McGraw Hill
Glencoe Algebra 1, Student Edition, 9780079039897…
Algebra
ISBN:
9780079039897
Author:
Carter
Publisher:
McGraw Hill