What is the false negative rate?

Chapter6: Exponential And Logarithmic Functions
Section6.8: Fitting Exponential Models To Data
Problem 3TI: Table 6 shows the population, in thousands, of harbor seals in the Wadden Sea over the years 1997 to...

Related questions
Question
Q13 14
Transcribed Image Text:10.
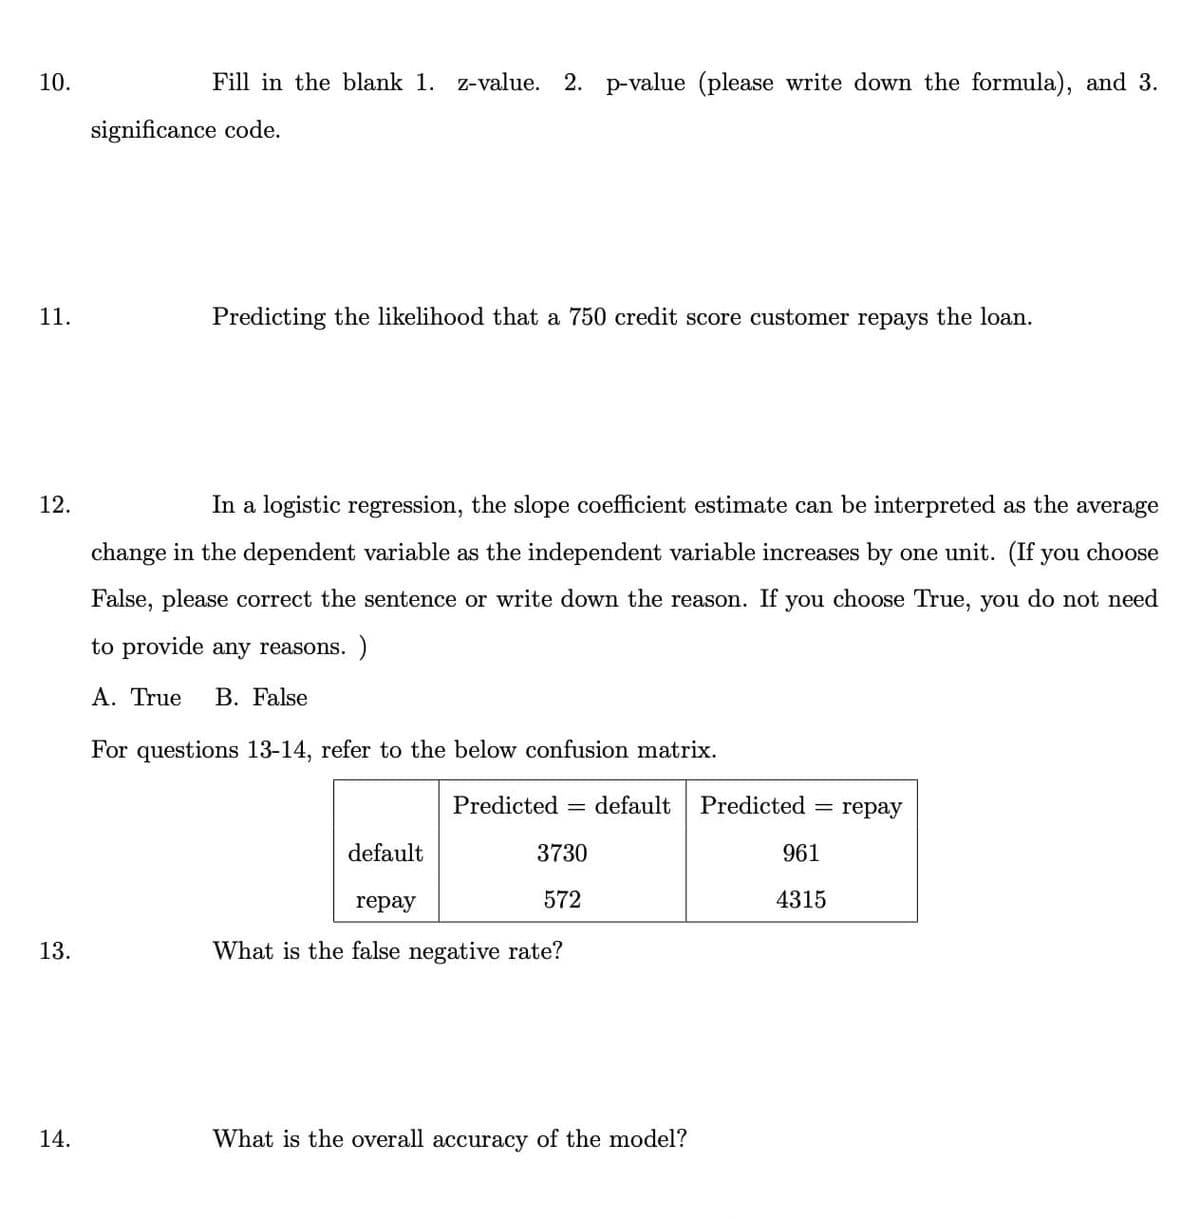
Fill in the blank 1. z-value. 2. p-value (please write down the formula), and 3.
significance code.
11.
Predicting the likelihood that a 750 credit score customer repays the loan.
12.
In a logistic regression, the slope coefficient estimate can be interpreted as the average
change in the dependent variable as the independent variable increases by one unit. (If you choose
False, please correct the sentence or write down the reason. If you choose True, you do not need
to provide any reasons. )
A. True
B. False
For questions 13-14, refer to the below confusion matrix.
Predicted =
default
Predicted
reрay
default
3730
961
repay
572
4315
13.
What is the false negative rate?
14.
What is the overall accuracy of the model?
Expert Solution
This question has been solved!
Explore an expertly crafted, step-by-step solution for a thorough understanding of key concepts.

Step by step
Solved in 2 steps

Recommended textbooks for you

Functions and Change: A Modeling Approach to Coll…
Algebra
ISBN:
9781337111348
Author:
Bruce Crauder, Benny Evans, Alan Noell
Publisher:
Cengage Learning

Algebra & Trigonometry with Analytic Geometry
Algebra
ISBN:
9781133382119
Author:
Swokowski
Publisher:
Cengage
Functions and Change: A Modeling Approach to Coll…
Algebra
ISBN:
9781337111348
Author:
Bruce Crauder, Benny Evans, Alan Noell
Publisher:
Cengage Learning
Algebra & Trigonometry with Analytic Geometry
Algebra
ISBN:
9781133382119
Author:
Swokowski
Publisher:
Cengage