The following table shows the length, in meters, of the winning long jump in the Olympic Games for the indicated year. (One meter is 39.37 inches.) 1900 7.19 1904 7.34 1908 7.48 1912 7.60 Year Length (a) Find the equation of the regression line that gives the length as a function of time. (Let r be the number of years since 1900 and L the length of the wining long jump, in meters. Round the regression line parameters to three decimal places.) L(e) = 7.197 +0.0342t (b) Explain in practical terms the meaning of the slope of the regression line. In practical terms the meaning of the slope, meter, or about| meter per year, of the regression line is that each year the length of the winning long jump increased by an average inches.
The following table shows the length, in meters, of the winning long jump in the Olympic Games for the indicated year. (One meter is 39.37 inches.) 1900 7.19 1904 7.34 1908 7.48 1912 7.60 Year Length (a) Find the equation of the regression line that gives the length as a function of time. (Let r be the number of years since 1900 and L the length of the wining long jump, in meters. Round the regression line parameters to three decimal places.) L(e) = 7.197 +0.0342t (b) Explain in practical terms the meaning of the slope of the regression line. In practical terms the meaning of the slope, meter, or about| meter per year, of the regression line is that each year the length of the winning long jump increased by an average inches.

College Algebra
7th Edition
ISBN:9781305115545
Author:James Stewart, Lothar Redlin, Saleem Watson
Publisher:James Stewart, Lothar Redlin, Saleem Watson
Chapter1: Equations And Graphs
Section: Chapter Questions
Problem 10T: Olympic Pole Vault The graph in Figure 7 indicates that in recent years the winning Olympic men’s...

Related questions

Concept explainers
Contingency Table
A contingency table can be defined as the visual representation of the relationship between two or more categorical variables that can be evaluated and registered. It is a categorical version of the scatterplot, which is used to investigate the linear relationship between two variables. A contingency table is indeed a type of frequency distribution table that displays two variables at the same time.
Binomial Distribution
Binomial is an algebraic expression of the sum or the difference of two terms. Before knowing about binomial distribution, we must know about the binomial theorem.
Topic Video
Question
5
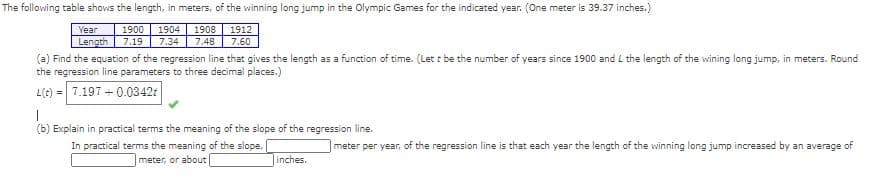
Transcribed Image Text:The following table shows the length, in meters, of the winning long jump in the Olympic Games for the indicated year. (One meter is 39.37 inches.)
Year
1900
1904
1908
1912
Length
7.19
7.34
7.48
7.60
(a) Find the equation of the regression line that gives the length as a function of time. (Let t be the number of years since 1900 and L the length of the wining long jump, in meters. Round
the regression line parameters to three decimal places.)
L(t) = 7.197 + 0.0342t
(b) Explain in practical terms the meaning of the slope of the regression line.
In practical terms the meaning of the slope,
meter, or about
meter per year, of the regression line is that each year the length of the winning long jump increased by an average of
inches.
Expert Solution
This question has been solved!
Explore an expertly crafted, step-by-step solution for a thorough understanding of key concepts.

This is a popular solution!

Trending now
This is a popular solution!

Step by step
Solved in 2 steps with 2 images

Knowledge Booster


Learn more about
Need a deep-dive on the concept behind this application? Look no further. Learn more about this topic, calculus and related others by exploring similar questions and additional content below.Recommended textbooks for you
College Algebra
Algebra
ISBN:
9781305115545
Author:
James Stewart, Lothar Redlin, Saleem Watson
Publisher:
Cengage Learning


Algebra & Trigonometry with Analytic Geometry
Algebra
ISBN:
9781133382119
Author:
Swokowski
Publisher:
Cengage
College Algebra
Algebra
ISBN:
9781305115545
Author:
James Stewart, Lothar Redlin, Saleem Watson
Publisher:
Cengage Learning
Algebra & Trigonometry with Analytic Geometry
Algebra
ISBN:
9781133382119
Author:
Swokowski
Publisher:
Cengage

Functions and Change: A Modeling Approach to Coll…
Algebra
ISBN:
9781337111348
Author:
Bruce Crauder, Benny Evans, Alan Noell
Publisher:
Cengage Learning

Algebra and Trigonometry (MindTap Course List)
Algebra
ISBN:
9781305071742
Author:
James Stewart, Lothar Redlin, Saleem Watson
Publisher:
Cengage Learning

College Algebra (MindTap Course List)
Algebra
ISBN:
9781305652231
Author:
R. David Gustafson, Jeff Hughes
Publisher:
Cengage Learning