The following table shows the personal income per capita for Tennessee in constant 2005 dollars for years since 1980 through 2000. Year TN income 3 10293 7 13754 11 17242 15 21339 19 25370 23 28455 30 35307 A scatter plot for the data with a graph of a linear model follows. 36000 + 33000- 30000- 27000- 24000 - 21000- 18000- 15000- 12000- 9000- 4 6 9 12 15 18 21 24 27 30 Use the above scatter plot to decide whether a linear model fits the data. O A linear model fits the data OAlinear model does not fit the data well. Let I(t) be the per capita income in TN in dollars for t years since 1980. A linear model for the data is I(t) = [ Estimate the per capita income in 2014. s[ Preview . Use three decimals in your answer. Round your answer to dollars. Use the model to predict the year in which the income will be $39300.
The following table shows the personal income per capita for Tennessee in constant 2005 dollars for years since 1980 through 2000. Year TN income 3 10293 7 13754 11 17242 15 21339 19 25370 23 28455 30 35307 A scatter plot for the data with a graph of a linear model follows. 36000 + 33000- 30000- 27000- 24000 - 21000- 18000- 15000- 12000- 9000- 4 6 9 12 15 18 21 24 27 30 Use the above scatter plot to decide whether a linear model fits the data. O A linear model fits the data OAlinear model does not fit the data well. Let I(t) be the per capita income in TN in dollars for t years since 1980. A linear model for the data is I(t) = [ Estimate the per capita income in 2014. s[ Preview . Use three decimals in your answer. Round your answer to dollars. Use the model to predict the year in which the income will be $39300.

Big Ideas Math A Bridge To Success Algebra 1: Student Edition 2015
1st Edition
ISBN:9781680331141
Author:HOUGHTON MIFFLIN HARCOURT
Publisher:HOUGHTON MIFFLIN HARCOURT
Chapter4: Writing Linear Equations
Section: Chapter Questions
Problem 9CA

Related questions
Question
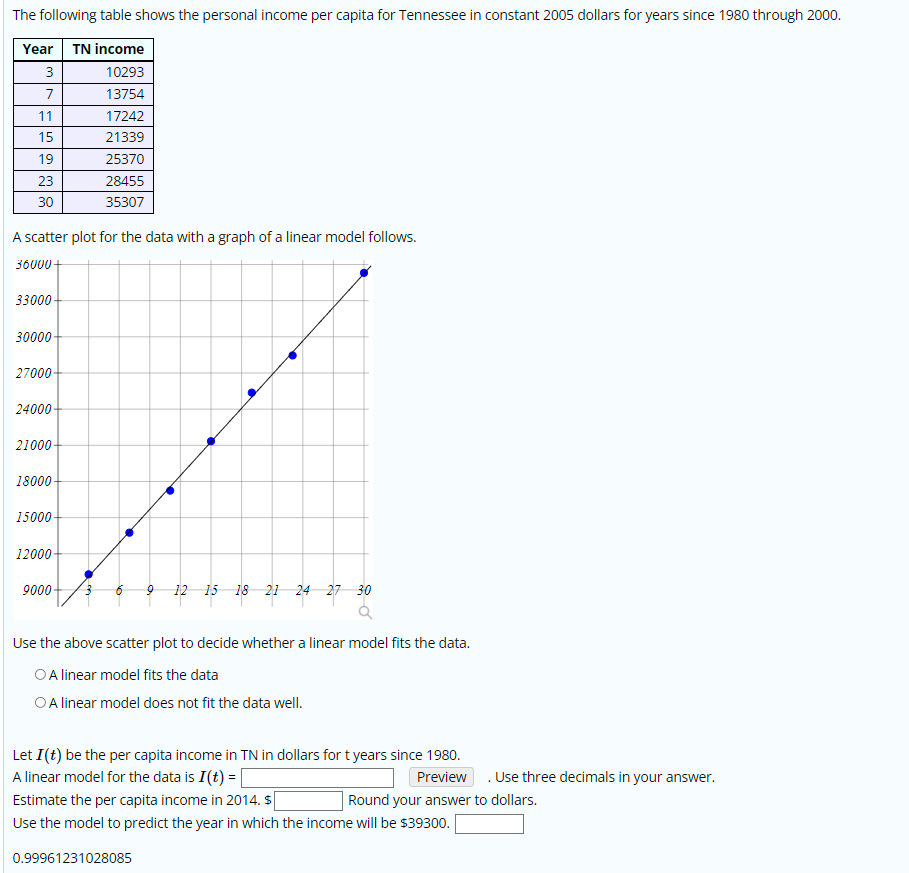
Transcribed Image Text:The following table shows the personal income per capita for Tennessee in constant 2005 dollars for years since 1980 through 2000.
Year TN income
3
10293
7
13754
11
17242
15
21339
19
25370
23
28455
30
35307
A scatter plot for the data with a graph of a linear model follows.
36000+
33000-
30000-
27000-
24000
21000
18000-
15000-
12000-
9000-
3 6 9 12 15 18 21 24 27 30
Use the above scatter plot to decide whether a linear model fits the data.
OAlinear model fits the data
OAlinear model does not fit the data well.
Let I(t) be the per capita income in TN in dollars for tyears since 1980.
A linear model for the data is I(t) =|
Estimate the per capita income in 2014. s
Use the model to predict the year in which the income will be s39300.
Preview . Use three decimals in your answer.
| Round your answer to dollars.
0.99961231028085
Expert Solution
This question has been solved!
Explore an expertly crafted, step-by-step solution for a thorough understanding of key concepts.

This is a popular solution!

Trending now
This is a popular solution!

Step by step
Solved in 4 steps

Recommended textbooks for you
Big Ideas Math A Bridge To Success Algebra 1: Stu…
Algebra
ISBN:
9781680331141
Author:
HOUGHTON MIFFLIN HARCOURT
Publisher:
Houghton Mifflin Harcourt

Glencoe Algebra 1, Student Edition, 9780079039897…
Algebra
ISBN:
9780079039897
Author:
Carter
Publisher:
McGraw Hill

Big Ideas Math A Bridge To Success Algebra 1: Stu…
Algebra
ISBN:
9781680331141
Author:
HOUGHTON MIFFLIN HARCOURT
Publisher:
Houghton Mifflin Harcourt
Glencoe Algebra 1, Student Edition, 9780079039897…
Algebra
ISBN:
9780079039897
Author:
Carter
Publisher:
McGraw Hill

Trigonometry (MindTap Course List)
Trigonometry
ISBN:
9781337278461
Author:
Ron Larson
Publisher:
Cengage Learning

Algebra & Trigonometry with Analytic Geometry
Algebra
ISBN:
9781133382119
Author:
Swokowski
Publisher:
Cengage
