The following table shows worldwide sales of a certain type of cell phone and their average wholesale prices in 2009 and 2010. Q1 Q1 2010 Quarter 2009 Wholesale Price ($) 170 160 Sales (millions)| 182 221 (a) Use the data to obtain a linear demand function for cell phones. q(p) = Use your demand equation to predict sales to the nearest million phones if the price was set at $163. (Round your answer to the nearest million phones.) million phones (b) Fill in the blank. For every $1 increase in price, sales of cell phones decrease by million units.
The following table shows worldwide sales of a certain type of cell phone and their average wholesale prices in 2009 and 2010. Q1 Q1 2010 Quarter 2009 Wholesale Price ($) 170 160 Sales (millions)| 182 221 (a) Use the data to obtain a linear demand function for cell phones. q(p) = Use your demand equation to predict sales to the nearest million phones if the price was set at $163. (Round your answer to the nearest million phones.) million phones (b) Fill in the blank. For every $1 increase in price, sales of cell phones decrease by million units.

Algebra and Trigonometry (MindTap Course List)
4th Edition
ISBN:9781305071742
Author:James Stewart, Lothar Redlin, Saleem Watson
Publisher:James Stewart, Lothar Redlin, Saleem Watson
Chapter2: Functions
Section2.4: Average Rate Of Change Of A Function
Problem 4.2E: bThe average rate of change of the linear function f(x)=3x+5 between any two points is ________.

Related questions
Question
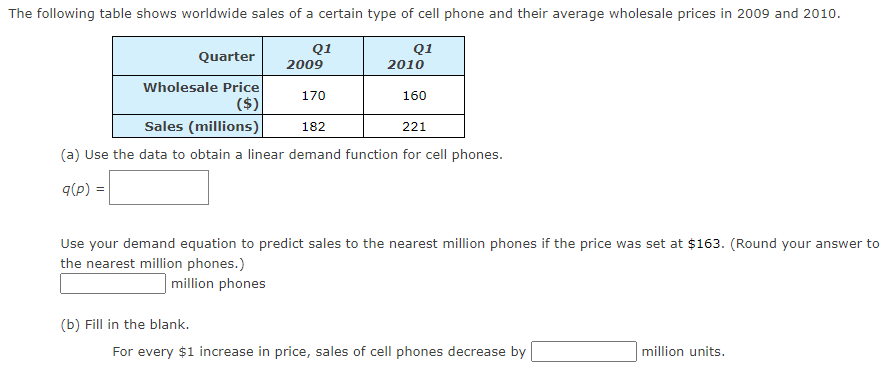
Transcribed Image Text:The following table shows worldwide sales of a certain type of cell phone and their average wholesale prices in 2009 and 2010.
Q1
2009
Q1
Quarter
2010
Wholesale Price
($)
170
160
Sales (millions)
182
221
(a) Use the data to obtain a linear demand function for cell phones.
q(p) =
Use your demand equation to predict sales to the nearest million phones if the price was set at $163. (Round your answer to
the nearest million phones.)
million phones
(b) Fill in the blank.
For every $1 increase in price, sales of cell phones decrease by
million units.
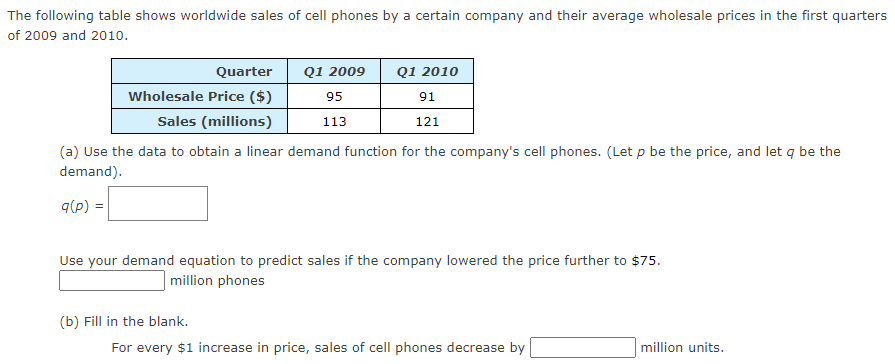
Transcribed Image Text:The following table shows worldwide sales of cell phones by a certain company and their average wholesale prices in the first quarters
of 2009 and 2010.
Quarter
Q1 2009
Q1 2010
Wholesale Price ($)
95
91
Sales (millions)
113
121
(a) Use the data to obtain a linear demand function for the company's cell phones. (Let p be the price, and let q be the
demand).
q(p) =
Use your demand equation to predict sales if the company lowered the price further to $75.
million phones
(b) Fill in the blank.
For every $1 increase in price, sales of cell phones decrease by
million units.
Expert Solution
This question has been solved!
Explore an expertly crafted, step-by-step solution for a thorough understanding of key concepts.

This is a popular solution!

Trending now
This is a popular solution!

Step by step
Solved in 4 steps with 1 images

Knowledge Booster


Learn more about
Need a deep-dive on the concept behind this application? Look no further. Learn more about this topic, algebra and related others by exploring similar questions and additional content below.Recommended textbooks for you
Algebra and Trigonometry (MindTap Course List)
Algebra
ISBN:
9781305071742
Author:
James Stewart, Lothar Redlin, Saleem Watson
Publisher:
Cengage Learning
Algebra and Trigonometry (MindTap Course List)
Algebra
ISBN:
9781305071742
Author:
James Stewart, Lothar Redlin, Saleem Watson
Publisher:
Cengage Learning