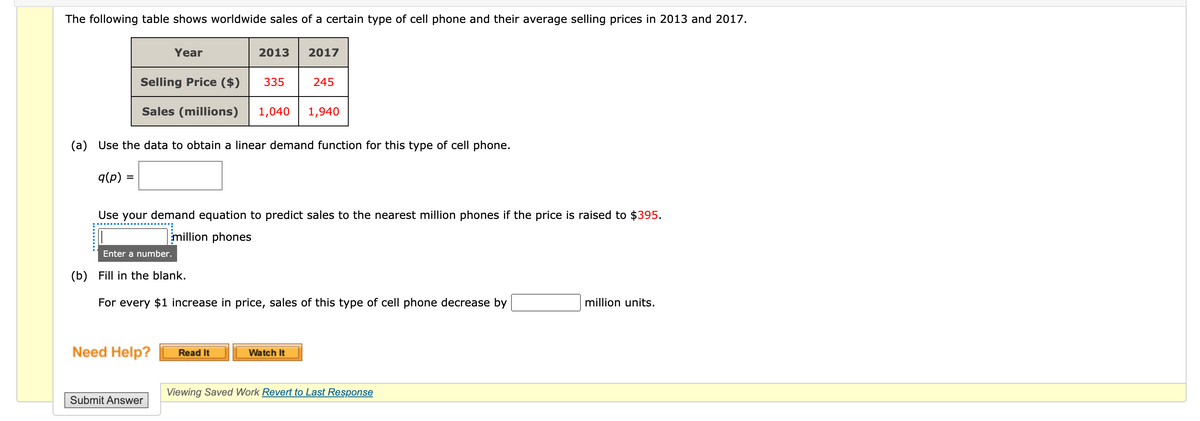
The following table shows worldwide sales of a certain type of cell phone and their average selling prices in 2013 and 2017. Year 2013 2017 Selling Price ($) 335 245 Sales (millions) 1,040 1,940 (a) Use the data to obtain a linear demand function for this type of cell phone. q(p) = Use your demand equation to predict sales to the nearest million phones if the price is raised to $395. million phones Enter a number. (b) Fill in the blank. For every $1 increase in price, sales of this type of cell phone decrease by million units. Need Help? Read It Watch It


Correlation
Correlation defines a relationship between two independent variables. It tells the degree to which variables move in relation to each other. When two sets of data are related to each other, there is a correlation between them.
Linear Correlation
A correlation is used to determine the relationships between numerical and categorical variables. In other words, it is an indicator of how things are connected to one another. The correlation analysis is the study of how variables are related.
Regression Analysis
Regression analysis is a statistical method in which it estimates the relationship between a dependent variable and one or more independent variable. In simple terms dependent variable is called as outcome variable and independent variable is called as predictors. Regression analysis is one of the methods to find the trends in data. The independent variable used in Regression analysis is named Predictor variable. It offers data of an associated dependent variable regarding a particular outcome.


Trending now
This is a popular solution!

Step by step
Solved in 4 steps


