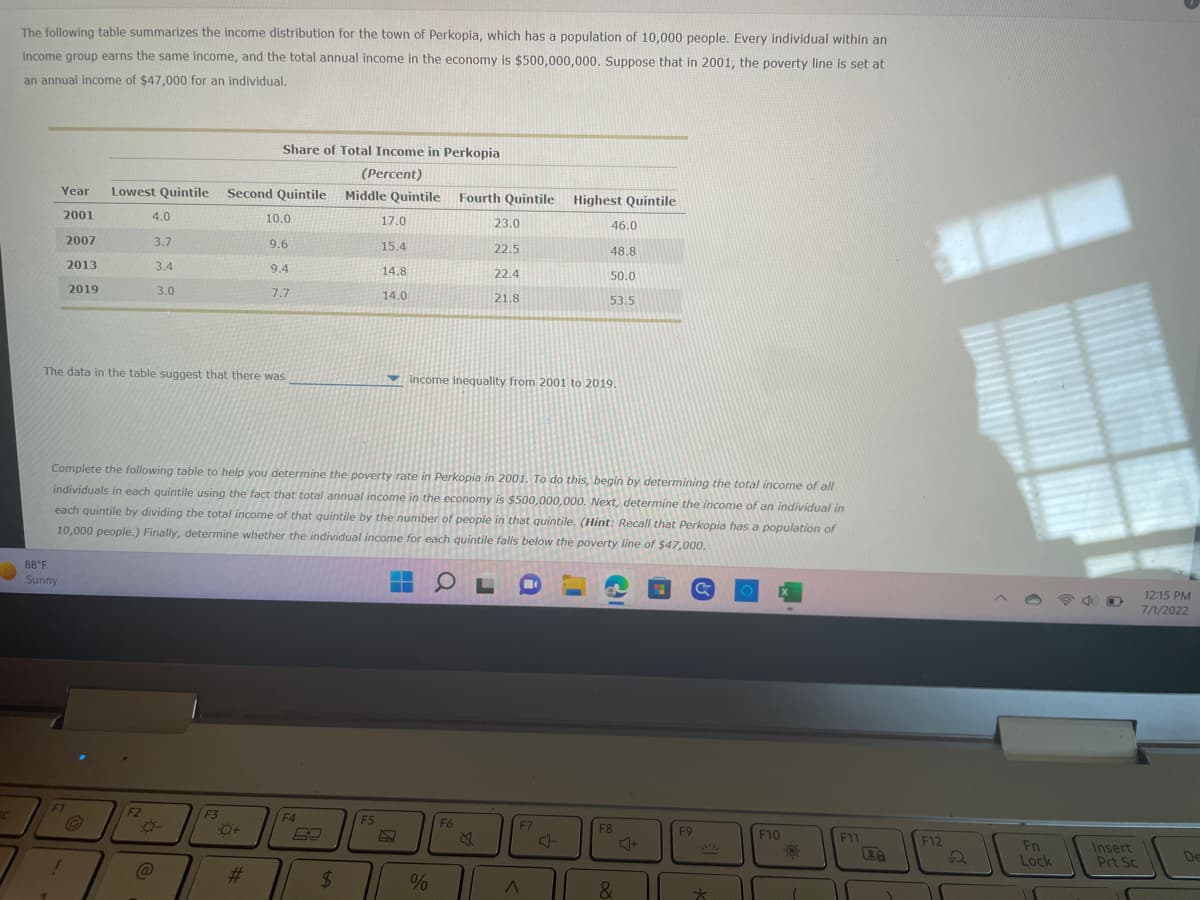
The following table summarizes the income distribution for the town of Perkopia, which has a population of 10,000 people. Every individual within an income group earns the same income, and the total annual income in the economy is $500,000,000. Suppose that in 2001, the poverty line is set at an annual income of $47,000 for an individual. Year 2001 2007 2013 2019 88°F Sunny Lowest Quintile Second Quintile 4.0 3.7 3.4 Share of Total Income in Perkopia (Percent) Middle Quintile Fourth Quintile Highest Quintile 3.0 10.0 9.6 9.4 7.7 The data in the table suggest that there was 17.0 15.4 14.8 14.0 23.0 22.5 22.4 21.8 46.0 48.8 50.0 53.5 income inequality from 2001 to 2019. Complete the following table to help you determine the poverty rate in Perkopia in 2001. To do this, begin by determining the total income of all individuals in each quintile using the fact that total annual income in the economy is $500,000,000. Next, determine the income of an individual in each quintile by dividing the total income of that quintile by the number of people in that quintile. (Hint: Recall that Perkopia has a population of 10,000 people.) Finally, determine whether the individual income for each quintile falls below the poverty line of $47,000.
The following table summarizes the income distribution for the town of Perkopia, which has a population of 10,000 people. Every individual within an income group earns the same income, and the total annual income in the economy is $500,000,000. Suppose that in 2001, the poverty line is set at an annual income of $47,000 for an individual. Year 2001 2007 2013 2019 88°F Sunny Lowest Quintile Second Quintile 4.0 3.7 3.4 Share of Total Income in Perkopia (Percent) Middle Quintile Fourth Quintile Highest Quintile 3.0 10.0 9.6 9.4 7.7 The data in the table suggest that there was 17.0 15.4 14.8 14.0 23.0 22.5 22.4 21.8 46.0 48.8 50.0 53.5 income inequality from 2001 to 2019. Complete the following table to help you determine the poverty rate in Perkopia in 2001. To do this, begin by determining the total income of all individuals in each quintile using the fact that total annual income in the economy is $500,000,000. Next, determine the income of an individual in each quintile by dividing the total income of that quintile by the number of people in that quintile. (Hint: Recall that Perkopia has a population of 10,000 people.) Finally, determine whether the individual income for each quintile falls below the poverty line of $47,000.

Holt Mcdougal Larson Pre-algebra: Student Edition 2012
1st Edition
ISBN:9780547587776
Author:HOLT MCDOUGAL
Publisher:HOLT MCDOUGAL
Chapter11: Data Analysis And Probability
Section11.5: Interpreting Data
Problem 1C

Related questions
Question
Which of the following statements are correct select all that apply.
Amy would gain more income by turning down overtime then she would if she accepted the over time
Amy may accept the over time if she feels that taking it will increase the chances of her receiving a significant promotion.
The $5000 in aid presents a distinctive for Amy to make note that $47,000 per year
Transcribed Image Text:The following table summarizes the income distribution for the town of Perkopia, which has a population of 10,000 people. Every individual within an
income group earns the same income, and the total annual income in the economy is $500,000,000. Suppose that in 2001, the poverty line is set at
an annual income of $47,000 for an individual.
Year
2001
2007
2013
2019
88°F
Sunny
F1
Lowest Quintile Second Quintile
O
4.0
3.7
3.4
3.0
The data in the table suggest that there was
F2
-0-
@
Share of Total Income in Perkopia
(Percent)
Middle Quintile Fourth Quintile Highest Quintile
F3
:0+
10.0
#
9.6
9.4
7.7
Complete the following table to help you determine the poverty rate in Perkopia in 2001. To do this, begin by determining the total income of all
individuals in each quintile using the fact that total annual income in the economy is $500,000,000. Next, determine the income of an individual in
each quintile by dividing the total income of that quintile by the number of people in that quintile. (Hint: Recall that Perkopia has a population of
10,000 people.) Finally, determine whether the individual income for each quintile falls below the poverty line of $47,000.
O
F4
59
$
17.0
15.4
F5
14.8
14.0
▬▬
T
23.0
22.5
%
22.4
income inequality from 2001 to 2019.
F6
21.8
46.0
48.8
50.0
53.5
F7
A
F8
&
F9
*
F10
O
F11
28
F12
Fn
Lock
11
Insert
Prt Sc
12:15 PM
7/1/2022
De
Transcribed Image Text:Quintile
Lowest
Second
Middle
Fourth
Highest
Esc
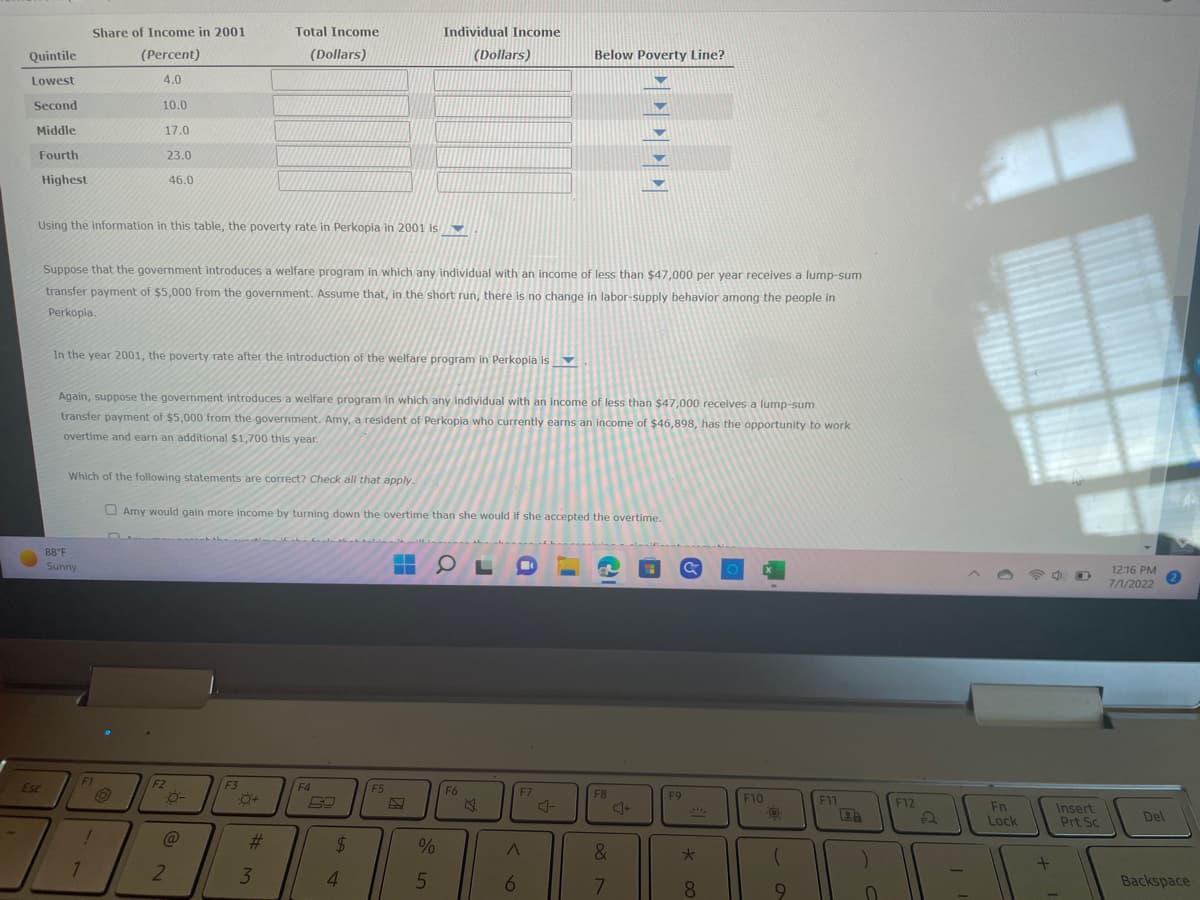
Using the information in this table, the poverty rate in Perkopia in 2001 is
Share of Income in 2001
(Percent)
4.0
10.0
17.0
23.0
46.0
88°F
Sunny
In the year 2001, the poverty rate after the introduction of the welfare program in Perkopia is
Which of the following statements are correct? Check all that apply.
F1
1
Suppose that the government introduces a welfare program in which any individual with an income of less than $47,000 per year receives a lump-sum
transfer payment of $5,000 from the government. Assume that, in the short run, there is no change in labor-supply behavior among the people in
Perkopia.
O
Again, suppose the government introduces a welfare program in which any individual with an income of less than $47,000 receives a lump-sum
transfer payment of $5,000 from the government. Amy, a resident of Perkopia who currently earns an income of $46,898, has the opportunity to work
overtime and earn an additional $1,700 this year.
F2
-0-
Total Income
(Dollars)
@
2
F3
:0+
Amy would gain more income by turning down the overtime than she would if she accepted the overtime.
#m
3
F4
SA
$
4
Individual Income
F5
▬▬
▬▬▬
(Dollars)
%
5
OL
F6
F7
Below Poverty Line?
A
6
J-
¡
-
Y
F8
▼
&
7
(
F9
&
*
8
F10
-0.
(
a
F11
F12
2
Fn
Lock
+
Insert
Prt Sc
12:16 PM
7/1/2022
Del
Backspace
Expert Solution
This question has been solved!
Explore an expertly crafted, step-by-step solution for a thorough understanding of key concepts.

This is a popular solution!

Trending now
This is a popular solution!

Step by step
Solved in 5 steps

Recommended textbooks for you
Holt Mcdougal Larson Pre-algebra: Student Edition…
Algebra
ISBN:
9780547587776
Author:
HOLT MCDOUGAL
Publisher:
HOLT MCDOUGAL
Holt Mcdougal Larson Pre-algebra: Student Edition…
Algebra
ISBN:
9780547587776
Author:
HOLT MCDOUGAL
Publisher:
HOLT MCDOUGAL