The frequency distribution was obtained using a class width of 0.5 for data on cigarette tax rates. Use the frequency distribution to approximate the population mean and population standard deviation Compare these results to the actual mean u = $1.502 and standard deviation o = $1.031. E Click the icon to view the frequency distribution for the tax rates. Frequency distribution of cigarette tax rates The population mean is $ Tax Rate Frequency E (Round to three decimal places as needed.) 0.00-0.49 0.50-0.99 14 The population standard deviation is $ (Round to three decimal places as needed.) 1.00–1.49 1.50-1.99 2.00-2.49 6. Compare these results to the values found using the actual data. 2.50-2.99 4. 3.00-3.49 3 O A. The grouped mean is slightly larger, while the grouped standard deviation is slightly smaller. 3.50-3.99 1 O B. The grouped mean is slightly smaller, while the grouped standard deviation is slightly larger. 4.00-4.49 OC. The grouped values are both slightly smaller. O D. The grouped values are both slightly larger. Print Done
The frequency distribution was obtained using a class width of 0.5 for data on cigarette tax rates. Use the frequency distribution to approximate the population mean and population standard deviation Compare these results to the actual mean u = $1.502 and standard deviation o = $1.031. E Click the icon to view the frequency distribution for the tax rates. Frequency distribution of cigarette tax rates The population mean is $ Tax Rate Frequency E (Round to three decimal places as needed.) 0.00-0.49 0.50-0.99 14 The population standard deviation is $ (Round to three decimal places as needed.) 1.00–1.49 1.50-1.99 2.00-2.49 6. Compare these results to the values found using the actual data. 2.50-2.99 4. 3.00-3.49 3 O A. The grouped mean is slightly larger, while the grouped standard deviation is slightly smaller. 3.50-3.99 1 O B. The grouped mean is slightly smaller, while the grouped standard deviation is slightly larger. 4.00-4.49 OC. The grouped values are both slightly smaller. O D. The grouped values are both slightly larger. Print Done

Glencoe Algebra 1, Student Edition, 9780079039897, 0079039898, 2018
18th Edition
ISBN:9780079039897
Author:Carter
Publisher:Carter
Chapter10: Statistics
Section: Chapter Questions
Problem 22SGR

Related questions
Question
The frequency distribution was obtained using a class width of 0.5 for data on cigarette tax rates. Use the frequency distribution to approximate the population
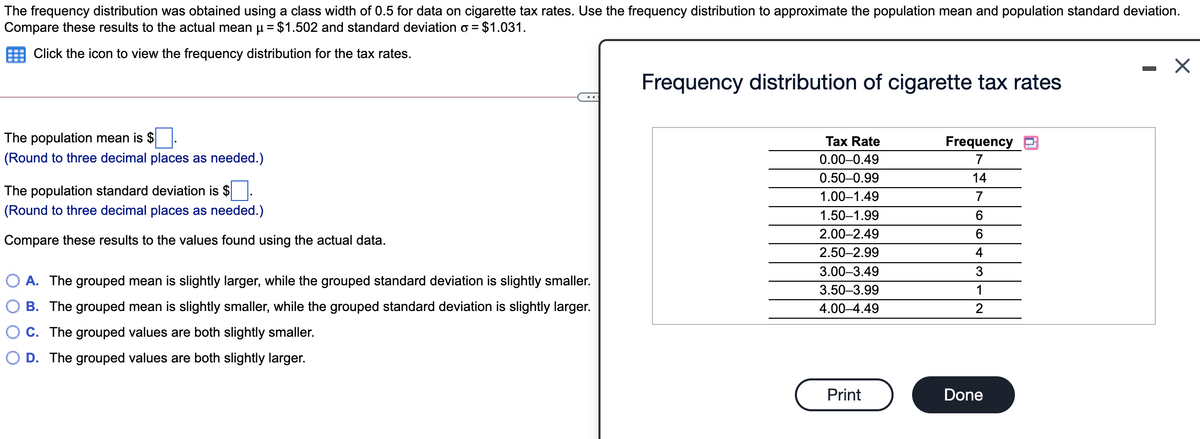
Transcribed Image Text:The frequency distribution was obtained using a class width of 0.5 for data on cigarette tax rates. Use the frequency distribution to approximate the population mean and population standard deviation.
Compare these results to the actual mean µ = $1.502 and standard deviation o = $1.031.
Click the icon to view the frequency distribution for the tax rates.
Frequency distribution of cigarette tax rates
The population mean is $
(Round to three decimal places as needed.)
Tax Rate
Frequency
0.00-0.49
7
0.50-0.99
14
The population standard deviation is $
1.00–1.49
7
(Round to three decimal places as needed.)
1.50–1.99
6.
2.00–2.49
Compare these results to the values found using the actual data.
2.50-2.99
4
3.00–3.49
3
A. The grouped mean is slightly larger, while the grouped standard deviation is slightly smaller.
3.50-3.99
1
B. The grouped mean is slightly smaller, while the grouped standard deviation is slightly larger.
4.00–4.49
C. The grouped values are both slightly smaller.
D. The grouped values are both slightly larger.
Print
Done
Expert Solution
Step 1
Here actual mean = 1.502
Actual standard deviation = 1.031
We have to calculate population mean and standard deviation and have to compare with actual data.

Trending now
This is a popular solution!

Step by step
Solved in 2 steps with 1 images

Recommended textbooks for you
Glencoe Algebra 1, Student Edition, 9780079039897…
Algebra
ISBN:
9780079039897
Author:
Carter
Publisher:
McGraw Hill

Big Ideas Math A Bridge To Success Algebra 1: Stu…
Algebra
ISBN:
9781680331141
Author:
HOUGHTON MIFFLIN HARCOURT
Publisher:
Houghton Mifflin Harcourt
Glencoe Algebra 1, Student Edition, 9780079039897…
Algebra
ISBN:
9780079039897
Author:
Carter
Publisher:
McGraw Hill
Big Ideas Math A Bridge To Success Algebra 1: Stu…
Algebra
ISBN:
9781680331141
Author:
HOUGHTON MIFFLIN HARCOURT
Publisher:
Houghton Mifflin Harcourt