The "Freshman 15" refers to the belief that college students gain 15 lb (or 6.8 kg) during their freshman year. Listed in the accompanying table are weights (kg) of randomly selected male college freshmen. The weights were measured in September and later in April. Use the listed paired sample data, and assume that the samples are simple random samples and that the differences have a distribution that is approximately normal. Complete parts (a) through (c). September 72 68 65 60 64 49 64 53 53 D April 59 69 71 61 68 50 68 52 56 a. Use a 0.01 significance level to test the claim that for the population of freshman male college students, the weights in September are less than the weights in the following April. In this example, H. is the mean value of the differences d for the population of all pairs of data, where each individual difference d is defined as the April weight minus the September weight. What are the null and alternative hypotheses for the hypothesis test? Ho: Hal v kg H1: Ha (Турe i imals. Do not round.)
The "Freshman 15" refers to the belief that college students gain 15 lb (or 6.8 kg) during their freshman year. Listed in the accompanying table are weights (kg) of randomly selected male college freshmen. The weights were measured in September and later in April. Use the listed paired sample data, and assume that the samples are simple random samples and that the differences have a distribution that is approximately normal. Complete parts (a) through (c). September 72 68 65 60 64 49 64 53 53 D April 59 69 71 61 68 50 68 52 56 a. Use a 0.01 significance level to test the claim that for the population of freshman male college students, the weights in September are less than the weights in the following April. In this example, H. is the mean value of the differences d for the population of all pairs of data, where each individual difference d is defined as the April weight minus the September weight. What are the null and alternative hypotheses for the hypothesis test? Ho: Hal v kg H1: Ha (Турe i imals. Do not round.)

Glencoe Algebra 1, Student Edition, 9780079039897, 0079039898, 2018
18th Edition
ISBN:9780079039897
Author:Carter
Publisher:Carter
Chapter10: Statistics
Section10.4: Distributions Of Data
Problem 19PFA

Related questions
Question
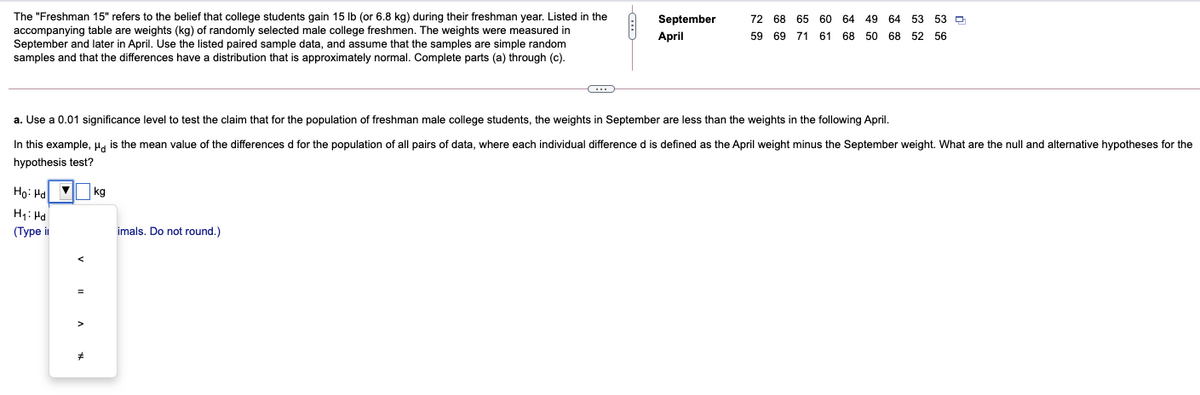
Transcribed Image Text:The "Freshman 15" refers to the belief that college students gain 15 lb (or 6.8 kg) during their freshman year. Listed in the
accompanying table are weights (kg) of randomly selected male college freshmen. The weights were measured in
September and later in April. Use the listed paired sample data, and assume that the samples are simple random
samples and that the differences have a distribution that is approximately normal. Complete parts (a) through (c).
September
72 68 65 60 64 49 64 53 53 D
April
59 69 71 61 68 50 68 52 56
a. Use a 0.01 significance level to test the claim that for the population of freshman male college students, the weights in September are less than the weights in the following April.
In this example, H. is the mean value of the differences d for the population of all pairs of data, where each individual difference d is defined as the April weight minus the September weight. What are the null and alternative hypotheses for the
hypothesis test?
Ho: Ha
kg
H1: Hd
(Турe i
imals. Do not round.)
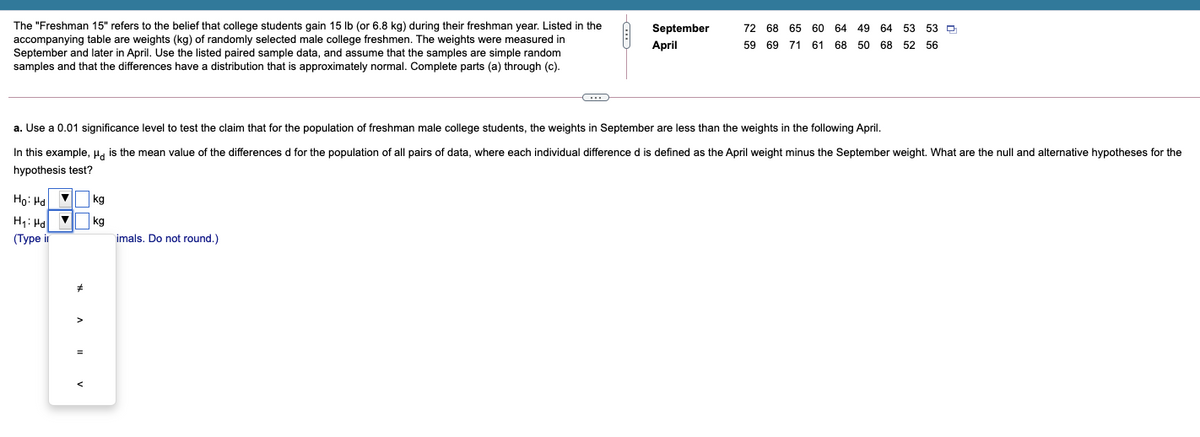
Transcribed Image Text:The "Freshman 15" refers to the belief that college students gain 15 lb (or 6.8 kg) during their freshman year. Listed in the
accompanying table are weights (kg) of randomly selected male college freshmen. The weights were measured in
September and later in April. Use the listed paired sample data, and assume that the samples are simple random
samples and that the differences have a distribution that is approximately normal. Complete parts (a) through (c).
September
72 68 65 60 64
49
64 53 53 O
April
59 69 71 61 68 50 68 52 56
a. Use a 0.01 significance level to test the claim that for the population of freshman male college students, the weights in September are less than the weights in the following April.
In this example, H, is the mean value of the differences d for the population of all pairs of data, where each individual difference d is defined as the April weight minus the September weight. What are the null and alternative hypotheses for the
hypothesis test?
Ho: Hd
kg
H1: Ha
(Турe i
kg
imals. Do not round.)
Expert Solution
This question has been solved!
Explore an expertly crafted, step-by-step solution for a thorough understanding of key concepts.

This is a popular solution!

Trending now
This is a popular solution!

Step by step
Solved in 2 steps with 2 images

Recommended textbooks for you
Glencoe Algebra 1, Student Edition, 9780079039897…
Algebra
ISBN:
9780079039897
Author:
Carter
Publisher:
McGraw Hill
Glencoe Algebra 1, Student Edition, 9780079039897…
Algebra
ISBN:
9780079039897
Author:
Carter
Publisher:
McGraw Hill