The function f is defined as follows. 4+x if x<0 f(x) = | x² if x20 (a) Find the domain of the function. (b) Locate any intercepts. (c) Graph the function. (d) Based on the graph, find the range.
The function f is defined as follows. 4+x if x<0 f(x) = | x² if x20 (a) Find the domain of the function. (b) Locate any intercepts. (c) Graph the function. (d) Based on the graph, find the range.

College Algebra (MindTap Course List)
12th Edition
ISBN:9781305652231
Author:R. David Gustafson, Jeff Hughes
Publisher:R. David Gustafson, Jeff Hughes
Chapter3: Functions
Section3.3: More On Functions; Piecewise-defined Functions
Problem 98E: Determine if the statemment is true or false. If the statement is false, then correct it and make it...

Related questions

Concept explainers
Contingency Table
A contingency table can be defined as the visual representation of the relationship between two or more categorical variables that can be evaluated and registered. It is a categorical version of the scatterplot, which is used to investigate the linear relationship between two variables. A contingency table is indeed a type of frequency distribution table that displays two variables at the same time.
Binomial Distribution
Binomial is an algebraic expression of the sum or the difference of two terms. Before knowing about binomial distribution, we must know about the binomial theorem.
Topic Video
Question
Thank you
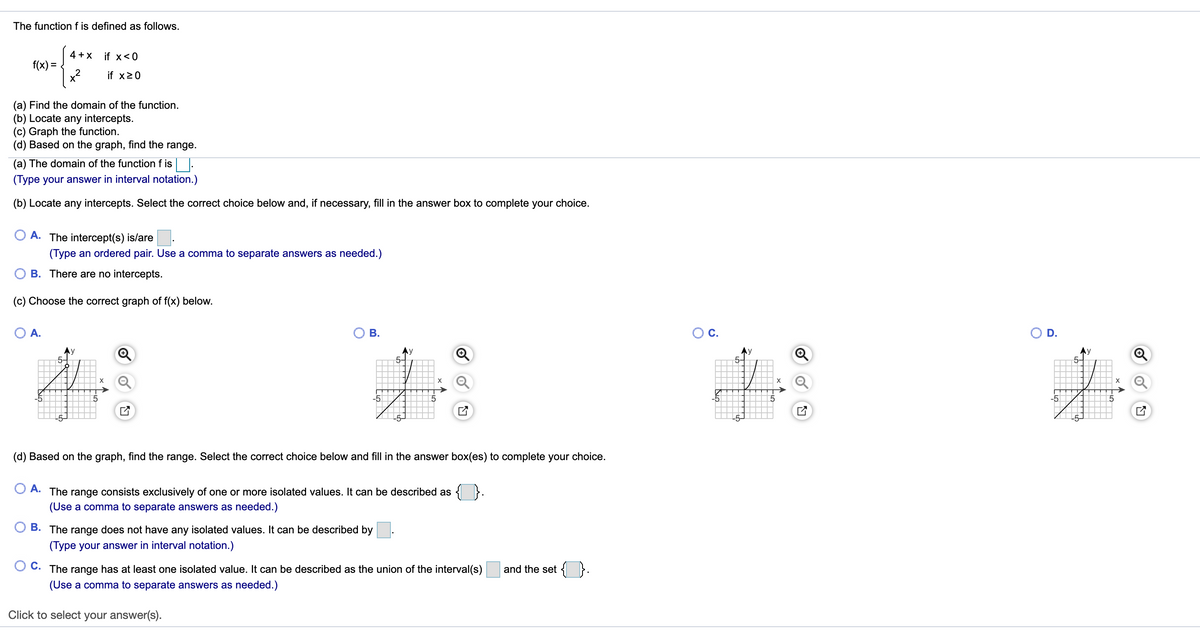
Transcribed Image Text:The function f is defined as follows.
4 + X
if x<0
f(x) =
x2
if x20
(a) Find the domain of the function.
(b) Locate any intercepts.
(c) Graph the function.
(d) Based on the graph, find the range.
(a) The domain of the function f is |.
(Type your answer in interval notation.)
(b) Locate any intercepts. Select the correct choice below and, if necessary, fill in the answer box to complete your choice.
A. The intercept(s) is/are
(Type an ordered pair. Use a comma to separate answers as needed.)
B. There are no intercepts.
(c) Choose the correct graph of f(x) below.
O A.
О В.
Oc.
OD.
Ay
X
X
X
-5
-5
L5-
(d) Based on the graph, find the range. Select the correct choice below and fill in the answer box(es) to complete your choice.
А.
{
The
range consists exclusively of one or more isolated values. It can be described as
(Use a comma to separate answers as needed.)
B. The range does not
ave any isolated values. It can
described by
(Type your answer in interval notation.)
С.
The range has at least one isolated value. It can be described as the union of the interval(s)
and the set { }.
(Use a comma to separate answers as needed.)
Click to select your answer(s).
![(a) Use a graphing utility to graph f(x) = 0.3x* + 0.2x° - 0.8x + 3 on the interval [-3,2] and approximate any local maxima and local minima.
(b) Determine where f is increasing and where it is decreasing.
A.
В.
OC.
Use MAXIMUM to find the local maximum of the graph.
The local maximum occurs at x =
and has a value of y =.
(Round to two decimal places.)
Use MINIMUM to find the local minima of the graph.
The local minima occur at x1 2
and at x2 , and have values of y, =
and y2 =
(Round to two decimal places. Use the smaller x-value as x1.)
Where is the graph of f increasing?
[-1.43,0]
[-3, - 1.43] and [0,0.93]
[- 3, – 1.43]
[- 1.43,0] and [0.93,2]
(Choose the answer that most completely answers the question.)
Where is the graph of f decreasing?
[-3, - 1.43] and [0,0.93]
[-3, – 1.43]
[-1.43,0]
[- 1.43,0] and [0.93,2]
(Choose the answer that most completely answers the question.)
Click to select your answer(s).](/v2/_next/image?url=https%3A%2F%2Fcontent.bartleby.com%2Fqna-images%2Fquestion%2F7c65428a-6c6a-4186-8234-e6e73e9c2b47%2F647829f8-f4c5-4478-89b1-4e10658b6e71%2Fyvsqpnp_processed.png&w=3840&q=75)
Transcribed Image Text:(a) Use a graphing utility to graph f(x) = 0.3x* + 0.2x° - 0.8x + 3 on the interval [-3,2] and approximate any local maxima and local minima.
(b) Determine where f is increasing and where it is decreasing.
A.
В.
OC.
Use MAXIMUM to find the local maximum of the graph.
The local maximum occurs at x =
and has a value of y =.
(Round to two decimal places.)
Use MINIMUM to find the local minima of the graph.
The local minima occur at x1 2
and at x2 , and have values of y, =
and y2 =
(Round to two decimal places. Use the smaller x-value as x1.)
Where is the graph of f increasing?
[-1.43,0]
[-3, - 1.43] and [0,0.93]
[- 3, – 1.43]
[- 1.43,0] and [0.93,2]
(Choose the answer that most completely answers the question.)
Where is the graph of f decreasing?
[-3, - 1.43] and [0,0.93]
[-3, – 1.43]
[-1.43,0]
[- 1.43,0] and [0.93,2]
(Choose the answer that most completely answers the question.)
Click to select your answer(s).
Expert Solution
This question has been solved!
Explore an expertly crafted, step-by-step solution for a thorough understanding of key concepts.

This is a popular solution!

Trending now
This is a popular solution!

Step by step
Solved in 2 steps with 2 images

Knowledge Booster


Learn more about
Need a deep-dive on the concept behind this application? Look no further. Learn more about this topic, algebra and related others by exploring similar questions and additional content below.Recommended textbooks for you
College Algebra (MindTap Course List)
Algebra
ISBN:
9781305652231
Author:
R. David Gustafson, Jeff Hughes
Publisher:
Cengage Learning

Algebra & Trigonometry with Analytic Geometry
Algebra
ISBN:
9781133382119
Author:
Swokowski
Publisher:
Cengage
College Algebra (MindTap Course List)
Algebra
ISBN:
9781305652231
Author:
R. David Gustafson, Jeff Hughes
Publisher:
Cengage Learning
Algebra & Trigonometry with Analytic Geometry
Algebra
ISBN:
9781133382119
Author:
Swokowski
Publisher:
Cengage