The function f(x) = 875(1.02}* represents the number of students at Martin High School x years after 2012. The table below shows the number of students at Lee High School since 2012. Year Number of Students 2012 750 2013 769 2014 788 2015 808 Using exponential models, if both schools continue to grow at the same rate, what is the approximate difference in the number of students attending the two high schoois in 2025? A 46 B 75 C 98 D 130
The function f(x) = 875(1.02}* represents the number of students at Martin High School x years after 2012. The table below shows the number of students at Lee High School since 2012. Year Number of Students 2012 750 2013 769 2014 788 2015 808 Using exponential models, if both schools continue to grow at the same rate, what is the approximate difference in the number of students attending the two high schoois in 2025? A 46 B 75 C 98 D 130

Chapter6: Exponential And Logarithmic Functions
Section6.7: Exponential And Logarithmic Models
Problem 16TI: Recent data suggests that, as of 2013, the rate of growth predicted by Moore’s Law no longer holds....

Related questions
Question
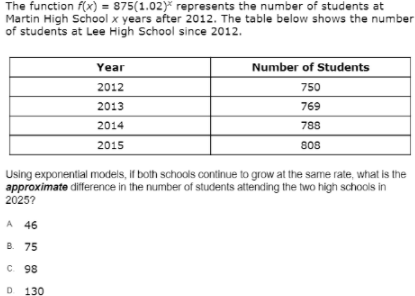
Transcribed Image Text:The function f(x) = 875(1.02)* represents the number of students at
Martin High School x years after 2012. The table below shows the number
of students at Lee High School since 2012.
Year
Number of Students
2012
750
2013
769
2014
788
2015
808
Using exponential models, if both schools continue to grow at the same rate, what is the
approximate difference in the number of students attending the two high schools in
2025?
A 46
B 75
C. 98
D 130
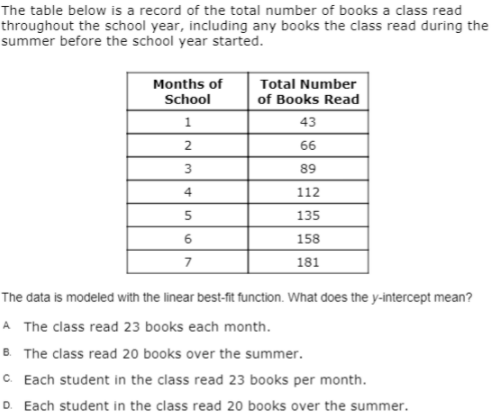
Transcribed Image Text:The table below is a record of the total number of books a class read
throughout the school year, including any books the class read during the
summer before the school year started.
Months of
Total Number
of Books Read
School
1
43
2
66
3
89
4
112
135
6
158
7
181
The data is modeled with the linear best-fit function. What does the y-intercept mean?
A The class read 23 books each month.
B. The class read 20 books over the summer.
c. Each student in the class read 23 books per month.
D. Each student in the class read 20 books over the summer.
Expert Solution
This question has been solved!
Explore an expertly crafted, step-by-step solution for a thorough understanding of key concepts.

This is a popular solution!

Trending now
This is a popular solution!

Step by step
Solved in 4 steps with 4 images

Knowledge Booster


Learn more about
Need a deep-dive on the concept behind this application? Look no further. Learn more about this topic, algebra and related others by exploring similar questions and additional content below.Recommended textbooks for you

Glencoe Algebra 1, Student Edition, 9780079039897…
Algebra
ISBN:
9780079039897
Author:
Carter
Publisher:
McGraw Hill

Glencoe Algebra 1, Student Edition, 9780079039897…
Algebra
ISBN:
9780079039897
Author:
Carter
Publisher:
McGraw Hill

Algebra & Trigonometry with Analytic Geometry
Algebra
ISBN:
9781133382119
Author:
Swokowski
Publisher:
Cengage

College Algebra (MindTap Course List)
Algebra
ISBN:
9781305652231
Author:
R. David Gustafson, Jeff Hughes
Publisher:
Cengage Learning

College Algebra
Algebra
ISBN:
9781305115545
Author:
James Stewart, Lothar Redlin, Saleem Watson
Publisher:
Cengage Learning