The function fx)2 -3+4 is graphed to the left 25 Which of the following best describes the Riemann approximation for the area under the curve from x-0 to x = 6 that is pictured here? 20 15 Right Riemann sum with n = Left Riemann sum with n-3 Midpoint Riemann sum with n = 3 Left Riemann sum with n 6 10 Right Riemann sum with n-3 2 -10 -5
The function fx)2 -3+4 is graphed to the left 25 Which of the following best describes the Riemann approximation for the area under the curve from x-0 to x = 6 that is pictured here? 20 15 Right Riemann sum with n = Left Riemann sum with n-3 Midpoint Riemann sum with n = 3 Left Riemann sum with n 6 10 Right Riemann sum with n-3 2 -10 -5

Algebra & Trigonometry with Analytic Geometry
13th Edition
ISBN:9781133382119
Author:Swokowski
Publisher:Swokowski
Chapter10: Sequences, Series, And Probability
Section10.5: The Binomial Theorem
Problem 49E

Related questions
Question
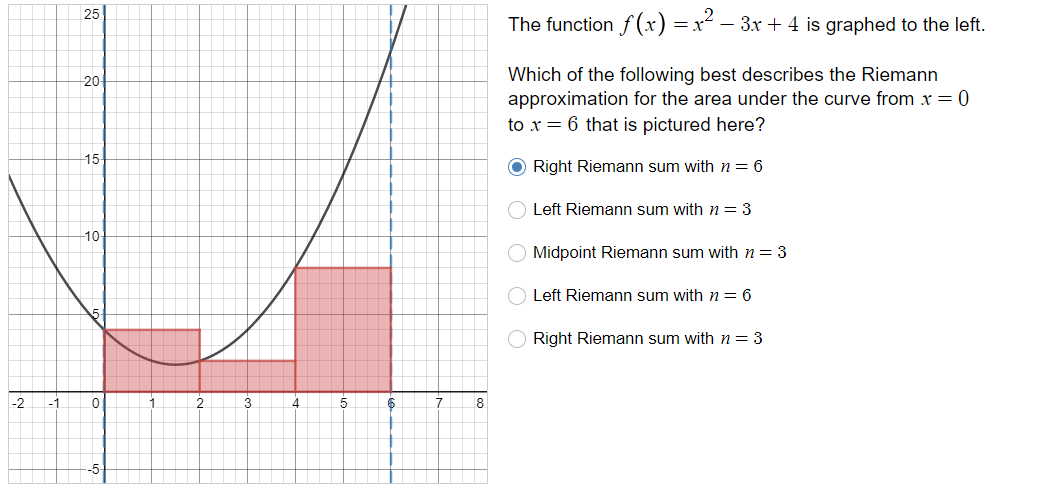
Transcribed Image Text:The function fx)2 -3+4 is graphed to the left
25
Which of the following best describes the Riemann
approximation for the area under the curve from x-0
to x = 6 that is pictured here?
20
15
Right Riemann sum with n =
Left Riemann sum with n-3
Midpoint Riemann sum with n = 3
Left Riemann sum with n 6
10
Right Riemann sum with n-3
2 -10
-5
Expert Solution
This question has been solved!
Explore an expertly crafted, step-by-step solution for a thorough understanding of key concepts.

This is a popular solution!

Trending now
This is a popular solution!

Step by step
Solved in 4 steps with 3 images

Recommended textbooks for you
Algebra & Trigonometry with Analytic Geometry
Algebra
ISBN:
9781133382119
Author:
Swokowski
Publisher:
Cengage
Algebra & Trigonometry with Analytic Geometry
Algebra
ISBN:
9781133382119
Author:
Swokowski
Publisher:
Cengage