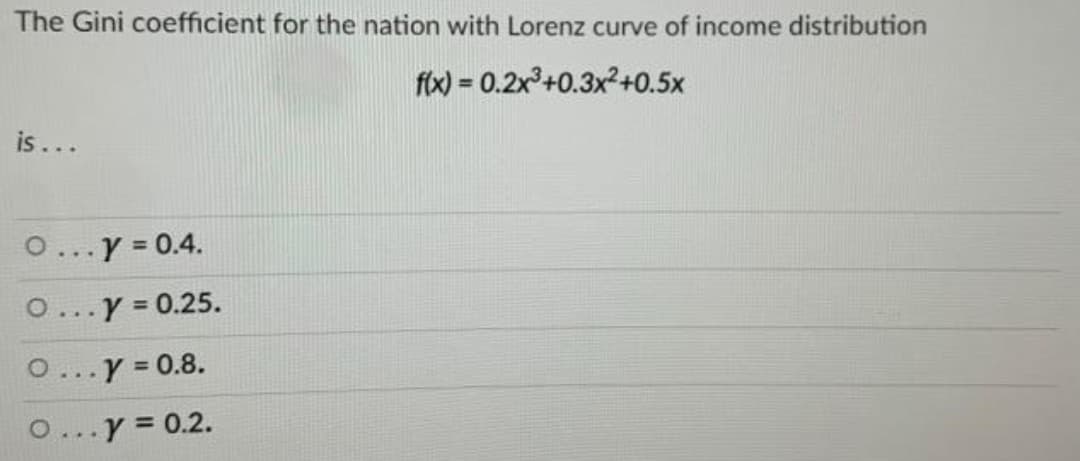
The Gini coefficient for the nation with Lorenz curve of income distribution f(x) = 0.2x +0.3x2+0.5x is... O...y 0.4. O...y 0.25. %3D O...y 0.8. Y = 0.2.


Q: A typical Lorenz Curve, extracted from the Textbook, is shown below: 100 80 Lorenz curve (actual…
A: The Lorenz curve is simply the graphical representation of income inequalities. The line of…
Q: The U.S. poverty rate for African Americans is substantially higher than that for Asians. True or…
A: Poverty refers to the situation of not having enough income of material possession to have a minimum…
Q: Consider five individuals, of whom three have zero income and two have $10,000 each. Based on Gini's…
A: There are 2 groups of people Group 1 consist 3 people with income 0 each person Group 2 consists 2…
Q: The figure below shows the proportion of children in earnings quantile conditional on their father's…
A: Here, only option 1 is correct. Children born in rich families folks are less likely to become poor…
Q: 2. The Lorenz curve of a particular society is given by L(x) = Ax? + Bx. Suppose that the poorest…
A: 2) The Lorenz curve depicts how money (or wealth) is distributed throughout an economy.It was…
Q: Examine the Lorenz Curves for Japan and Portugal shown in Figure 5. Which of the following…
A: The X axis represents the percentage of households in the society and the Y axis represents the…
Q: Economics Suppose that at date 1 the distribution of income is (1, 2, 3), while later, at date 2, it…
A: Income Inequality refers to the unequal distribution of income among the individuals of an economy.…
Q: 100 90 Lorenz curve for equal income distribution 1968 80 70 2018 60 50 40 30 20 10 20 40 60 80 100…
A: Lorenz curve is a diagrammatical way to measure income inequality. It is used in economic research…
Q: A country's Lorentz curve, y = L(x), provides us with insight into the country's income inequality.…
A: Gini index is a measure of the distribution of income amongst its population. It is an indicator of…
Q: Suppose that a society contains only two members, a lawyer named Monique and a handyman named James.…
A: A society contains only two members, a lawyer named Monique and a handyman named James. Monique made…
Q: In the figure above, which of the following is true? a. Distribution OYB is preferred to OZB, b.…
A: The above-mentioned graph is the Lorenz curve which represents the Gini coefficient that is a…
Q: Consider an income distribution S: (10, 20, 30, 50, 100). Suppose it is divided into two groups,…
A: Poverty line The poverty line in an economy represents the minimum level of income, which shows the…
Q: Item#1 Draw the Lorenz curve and compute the Gini index of a group whose incomes are 25, 32, 60, 40,…
A: The provided data set is: 25, 32, 60, 40, 38, 50
Q: b) Suppose one person in a population owns all the income and everyone else has none. Write down the…
A: A Lorenz curve is a graphical representation of the distribution of income or wealth within a…
Q: 2. The Lorenz curve of a particular society is given by L(x) = Ax? + Bx. Suppose that the poorest…
A: A graphical depiction of the distribution of wealth or income across a population is known as a…
Q: The income distribution for a population of 5 individuals is given as: 2,3,4,5 and 6. The poverty…
A: Foster-Greer-Thorbecke Method is a method to measure poverty line. People whose income is less than…
Q: Among the properties of the inequality indices, we have seen the Pigou Dalton principle. Do You…
A: Pigou Dalton principle approach towards maximize the social welfare. It states that allocation in an…
Q: The basic economic argument for creating greater income inequality is that: Oa more equal…
A: The degree to which wealth is distributed unequally within a society is referred to as income…
Q: A governmental agency determines that the Lorentz curves for the distribution of income for two…
A: The Lorenz curve is a way to measure income inequality. In this method, we arrange individuals of a…
Q: Find the Gini index for the given Lorenz curve. L(x) = 0.7x + 0.3x2
A: Gini index for the Lorenz curve can be calculated as follows:
Q: Why is the wage distribution positively skewed? (ii) Describe how to calculate the Gini coefficient.…
A: The Gini coefficient's principal advantage is that it is a proportion of imbalance, not a…
Q: ) If a Lorenz curve is differentiable, the slope of the Lorenz curve can be used to analyse income…
A: A Lorenz curve is a graphical representation of a community's income or wealth distribution.Lorenz…
Q: The area between the Lorenz curve of a country and the diagonal of perfect equality represents: ОА.…
A: In economics, Lorenz curve is an economic measure to graphically represent the inequality among…
Q: Select all true statements about the evolution of inequality in Canada between 1975 and 2019…
A: If we look at data from the World bank, we will get the data of the Gini Coefficient for the country…
Q: A group of 10 people have the following annual incomes: $24, 000, $18, 000, $50, 000, $100, 000,…
A: Solution: Writing the given incomes in increasing order. First quintile 10000 12000 Second…
Q: The graph below shows the Lorenz curves of two different countries stylistically called ‘red’ and…
A: The Gini index, often known as the Gini coefficient, measures income distribution throughout a…
Q: Which of the following factors does NOT contribute to income inequality? A. THE RISE OF…
A: Income inequality is the wide gap between the money earned by the richest people in an economy when…
Q: Below is the Lorenz curve of the country Laurania. Lorenz Curve of Laurania 100 100 Cumulative…
A: Gini coefficient is a measure of income inequality in a country.
Q: By finding the ___________, Gini Coefficient is determined/calculated. a. difference between the…
A: The correct answer is given in the second step.
Q: draw the Lorenz curve and compute the Gini index of a group whose incomes are 25, 32, 60, 40, 38, 50
A: The provided data set is: 25, 32, 60, 40, 38, 50
Q: Which statements are TRUE? Perfect inequality in distribution of income can be exhibited in…
A: Hello. Since your question has multiple sub-parts, we will solve first three sub-parts for you. If…
Q: In the Lorenz curve, the final entry in the cumulative income column needs to be 0% 45% 100%…
A: Lorenz curve is a curve of distribution of income with an economy.
Q: If in 2009 Indonesia had a Gini index of income distribution of 36.8 and Brazil had a Gini index of…
A: Gini coefficient or Gini index is a statistical tool which measures income inequality in a country…
Q: Suppose that the Lorenz Curve for country A is given by YA = x².2 and for country B is yB = 0.3x² +…
A: In this question the Lorentz curve is given for the two different countries, the Lorentz curve…
Q: What are the Gini Coefficient and the Lorenz Curve? Be sure to explain how these terms are related…
A: Both of these are used to measure inequality associated with income/wealth. Gini coefficient/index…
Q: Cumulative 100% percentage of income - Niger 90% 80% ---Argentina 70% 60% 50% 40% 30% 20% 10% 0% 0%…
A: The straight diagonal line is the line of equality as it divides the box into two equal parts. So if…
Q: Canada had the following distribution of Income after taxes in 2006 Based on the information in the…
A: Gini Coefficient is a widely used measure for income inequality in the countries . Gini Coefficient…
Q: Percent of Percent of income income Beta Household percentage Lowest 20 percent Second 20 percent…
A: In an economy, Lorenz curve refers to line that shows the income inequality among the people of a…
Q: In an effort to make the distribution of income more nearly equal, the government of a country…
A: Since you have asked multiple questions, we will solve the first question for you. If you want any…
Q: The top 1 percent of American households hold nearly 40percent of the total wealth. T or F?
A: Macroeconomics is important for a country. Aggregate demand and aggregate supply are parts of…
Q: Consider ten households, A through J, whose incomes are as shown below (first line). A C D E F G H.…
A: The distribution of income among the different sections of the population varies in most countries.…
Q: Q8.4) Formula for Gini Coefficient from Lorenz Curve A / A + B What does the A and B represent?
A: Gini's Coefficient is represented on scale of 0 to 1. It shows the income inequality within the…
Q: a. Is the presence of an underground economy likely to result in a Gini coefficient that overstates…
A: Gini coefficient is often being used as a gauge of economic inequality which measures the…
Q: Draw the Lorenz curve and compute the Gini index of a group whose annual incomes (in thousands of…
A: Gini coefficient is a statistical tool to measure income inequality within a nation. Its value…
Q: The values in the table reflect the percentages of pre-tax-and transfer income. 22. Refer to Table…
A: Inequality is when the gap of the wealth or income between the richest and the poorest section of…
Q: A group of 10 golfing buddies have the following annual incomes: Income $32, 000 $12, 000 $56, 000…
A: Income quantile An income quintile is a measure of income distribution status that divides the…
Q: Questions Explain three methods of measuring the income inequality of a nation? 1.kuznet ratio 2.…
A: Income inequality refer to the uneven distribution of the income generated in the economy during a…


Trending now
This is a popular solution!

Step by step
Solved in 2 steps

- If a country had perfect income equality what would the Lorenz curve look like?Q8.2) Lorenz CurveA curve illustrating the degree of equality of income distribution in an economy. It plots thecumulative percentage of income received by cumulative shares of the population. Where dowe fare as a country on the Lorenz curve and what does it say about South Africa’s incomedistributionNo written by hand solution Consider a 100-person economy, where half of the population receives 20% of the total income and the other half the remaining 80%. Using the Lorenz-curve approximation, what is the Gini coefficient in this economy (please use the comma to seprare decimals, such as: x,y)?
- Questions Explain three methods of measuring the income inequality of a nation? 1.kuznet ratio 2. Lorenz curve 3. Gini coefficient As in the case of income distribution, calculation of wealth distribution is done by different entities using different measurements, resulting in a disparity in outcomes. In fact, commonly, wealthis narrowly defined as financial wealth—namely, cash on handand the money value of tangible and nonliquid assets. Even justthe market valuation of financial portfolios is commonly used todefine financial wealth. However, some may extend the definitionto include the value of income streams and insurance rights that,for the most part, cannot be transacted or encumbered. Theseinclude Medicare, Medicaid, and Social Security. When suchtransfers and public assistance are included, the poor and manyelderly could benefit, reducing the wealth disparity (Galbraith2016). To obtain net wealth, the value of the debts are subtractedsubtracted from the value of the assets.…Questions Explain three methods of measuring the income inequality of a nation? Page 3 other 2 pages in the pic As in the case of income distribution, calculation of wealth distribution is done by different entities using different measurements, resulting in a disparity in outcomes. In fact, commonly, wealthis narrowly defined as financial wealth—namely, cash on handand the money value of tangible and nonliquid assets. Even justthe market valuation of financial portfolios is commonly used todefine financial wealth. However, some may extend the definitionto include the value of income streams and insurance rights that,for the most part, cannot be transacted or encumbered. Theseinclude Medicare, Medicaid, and Social Security. When suchtransfers and public assistance are included, the poor and manyelderly could benefit, reducing the wealth disparity (Galbraith2016). To obtain net wealth, the value of the debts are subtractedsubtracted from the value of the assets. Galbraith stated…a. Is the presence of an underground economy likely to result in a Gini coefficient that overstates or understates poverty? b. Consider a simple economy where 90 percent of citizens report an annual income of $10,000 while the remaining 10 percent report an annual income of $110,000. What is the Gini coefficient associated with this economy? c. Suppose the poorest 90 percent of citizens actually have an income of $15,000 because each receives $5,000 of unreported income from the underground economy. What is the Gini coefficient now?
- Which of the following statements regarding the Gini coefficient are correct? A. It is the measure of the average difference in income between every pair of individuals in the population. B. It can be calculated exactly as g=A/(A+B), where A is the area between the Lorenz curve and the 45-degree line, and A + B is the area under the 45-degree line. C. The fraction A/(A+B) is an accurate approximation when the population is small. D. If 50% of a large population owned 2% of the wealth each, then the Gini coefficient equals 0.6.Suppose a Lorenz curve for a particular country is f(x)=x^2for 0≤x≤1. What is the Gini index of income concentration for this country? Give your answer to the nearest integerA Gini coefficient of 0.15 would indicate that a society’s distribution of income is: A. PERFECTLY EQUAL B. RELATIVELY EQUAL C. MODERATELY UNEQUAL D. VERY UNEQUAL E. THE MOST UNEQUAL POSSIBLE
- Suppose that the Gini coefficient for Niger is 0.23 and the Gini coefficient for Canada is 0.34. From this, it is possible to conclude that these countries have…[Select one] different levels of absolute poverty. different Pigou-Dalton transfers. different levels of severe poverty. different Lorenz curves.The values in the table reflect the percentages of pre-tax-and transfer income. 22. Refer to Table 20-1. The trend in income inequality from 1980 to 2010 is 23. Refer to Table 20-1. If the distribution of income were completely equal, what percentage of income would the bottom fifth of the population earn? 24. A government policy aimed at protecting people against the risk of adverse events is calledGive a numerical example of how the headcount index doesn’t account for changes in the distribution below the poverty line. Assuming that the poverty line is 2, calculate the values of the index for each of the following distributions: a) (1, 2, 3) b) (1.5, 1.5, 3) c) (1, 2, 2, 3) d) (0.75, 2.5, 2.75)


