The given bar graph shows the percentage of gross domestic product (GDP) in a state going toward health care from 2007 through 2010, with projections for 2014 and 2019. The data are modeled by the function f(x) = 1.3 In x+13.8, where f(x) is the percentage of gross domestic product going toward health care x years after 2006. Use this information to solve parts a and b. Percentage of the Gross Domestic Product in the State 17.8 15 13.6 143 15.7 15.8 15.9 2008 2009 20TO 2014 2019 a. Use the function to determine the percentage of gross domestic product that went toward health care in 2008. Does this underestimate or overestimate the percent displayed by the graph? By how much? Determine the percentage of gross domestic product that went toward health care in 2008 using the given function. (Do not round until the final answer. Then round to the nearest tenth as needed.) Percentage of GDP
The given bar graph shows the percentage of gross domestic product (GDP) in a state going toward health care from 2007 through 2010, with projections for 2014 and 2019. The data are modeled by the function f(x) = 1.3 In x+13.8, where f(x) is the percentage of gross domestic product going toward health care x years after 2006. Use this information to solve parts a and b. Percentage of the Gross Domestic Product in the State 17.8 15 13.6 143 15.7 15.8 15.9 2008 2009 20TO 2014 2019 a. Use the function to determine the percentage of gross domestic product that went toward health care in 2008. Does this underestimate or overestimate the percent displayed by the graph? By how much? Determine the percentage of gross domestic product that went toward health care in 2008 using the given function. (Do not round until the final answer. Then round to the nearest tenth as needed.) Percentage of GDP

Algebra & Trigonometry with Analytic Geometry
13th Edition
ISBN:9781133382119
Author:Swokowski
Publisher:Swokowski
Chapter7: Analytic Trigonometry
Section7.6: The Inverse Trigonometric Functions
Problem 94E

Related questions
Topic Video
Question
100%
Does this underestimate or overestimate
percent displayed by the graph? Select the corect choice below.
A Overesimates by…%
B Underesimates by….%
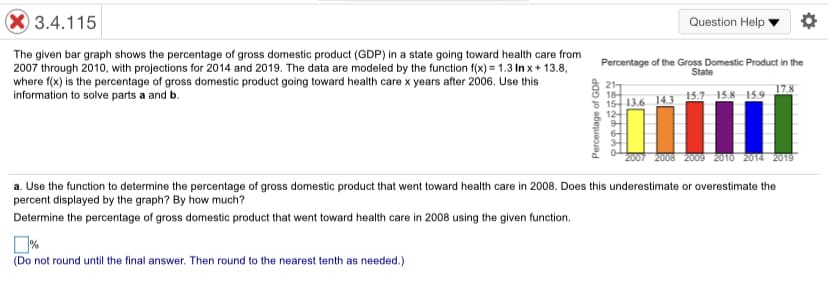
Transcribed Image Text:3.4.115
Question Help
The given bar graph shows the percentage of gross domestic product (GDP) in a state going toward health care from
2007 through 2010, with projections for 2014 and 2019. The data are modeled by the function f(x) = 1.3 In x+ 13.8,
where f(x) is the percentage of gross domestic product going toward health care x years after 2006. Use this
information to solve parts a and b.
Percentage of the Gross Domestic Product in the
State
21
18
15 13.6 14.3 15.7 15.8 15,9
12-
17.8
2007 2008 2009 2010 2014 2019
a. Use the function to determine the percentage of gross domestic product that went toward health care in 2008. Does this underestimate or overestimate the
percent displayed by the graph? By how much?
Determine the percentage of gross domestic product that went toward health care in 2008 using the given function.
(Do not round until the final answer. Then round to the nearest tenth as needed.)
Percentage of GDP
Expert Solution
This question has been solved!
Explore an expertly crafted, step-by-step solution for a thorough understanding of key concepts.

This is a popular solution!

Trending now
This is a popular solution!

Step by step
Solved in 2 steps

Knowledge Booster


Learn more about
Need a deep-dive on the concept behind this application? Look no further. Learn more about this topic, statistics and related others by exploring similar questions and additional content below.Recommended textbooks for you
Algebra & Trigonometry with Analytic Geometry
Algebra
ISBN:
9781133382119
Author:
Swokowski
Publisher:
Cengage

Glencoe Algebra 1, Student Edition, 9780079039897…
Algebra
ISBN:
9780079039897
Author:
Carter
Publisher:
McGraw Hill

Algebra and Trigonometry (MindTap Course List)
Algebra
ISBN:
9781305071742
Author:
James Stewart, Lothar Redlin, Saleem Watson
Publisher:
Cengage Learning
Algebra & Trigonometry with Analytic Geometry
Algebra
ISBN:
9781133382119
Author:
Swokowski
Publisher:
Cengage
Glencoe Algebra 1, Student Edition, 9780079039897…
Algebra
ISBN:
9780079039897
Author:
Carter
Publisher:
McGraw Hill
Algebra and Trigonometry (MindTap Course List)
Algebra
ISBN:
9781305071742
Author:
James Stewart, Lothar Redlin, Saleem Watson
Publisher:
Cengage Learning