The given below is a cumulative frequency histogram of scores on a standardized coding final exam at a Computer College. 100 80 60 40 20 20 40 60 80 100 Which of the statements below is the correct one among all? a. With each interval of 10, the greatest number of students scored in the 90s. b. There is no score in the 30s. C. Approximately uniform is the distribution of scores. d. Most of the scores were above 80. е. The median of the data is less than 60.
The given below is a cumulative frequency histogram of scores on a standardized coding final exam at a Computer College. 100 80 60 40 20 20 40 60 80 100 Which of the statements below is the correct one among all? a. With each interval of 10, the greatest number of students scored in the 90s. b. There is no score in the 30s. C. Approximately uniform is the distribution of scores. d. Most of the scores were above 80. е. The median of the data is less than 60.

Glencoe Algebra 1, Student Edition, 9780079039897, 0079039898, 2018
18th Edition
ISBN:9780079039897
Author:Carter
Publisher:Carter
Chapter10: Statistics
Section10.4: Distributions Of Data
Problem 19PFA

Related questions
Question
PLESS ANSWER Everything pls help me.... so hard for me. no need step by step help me.! thanks exper=ts
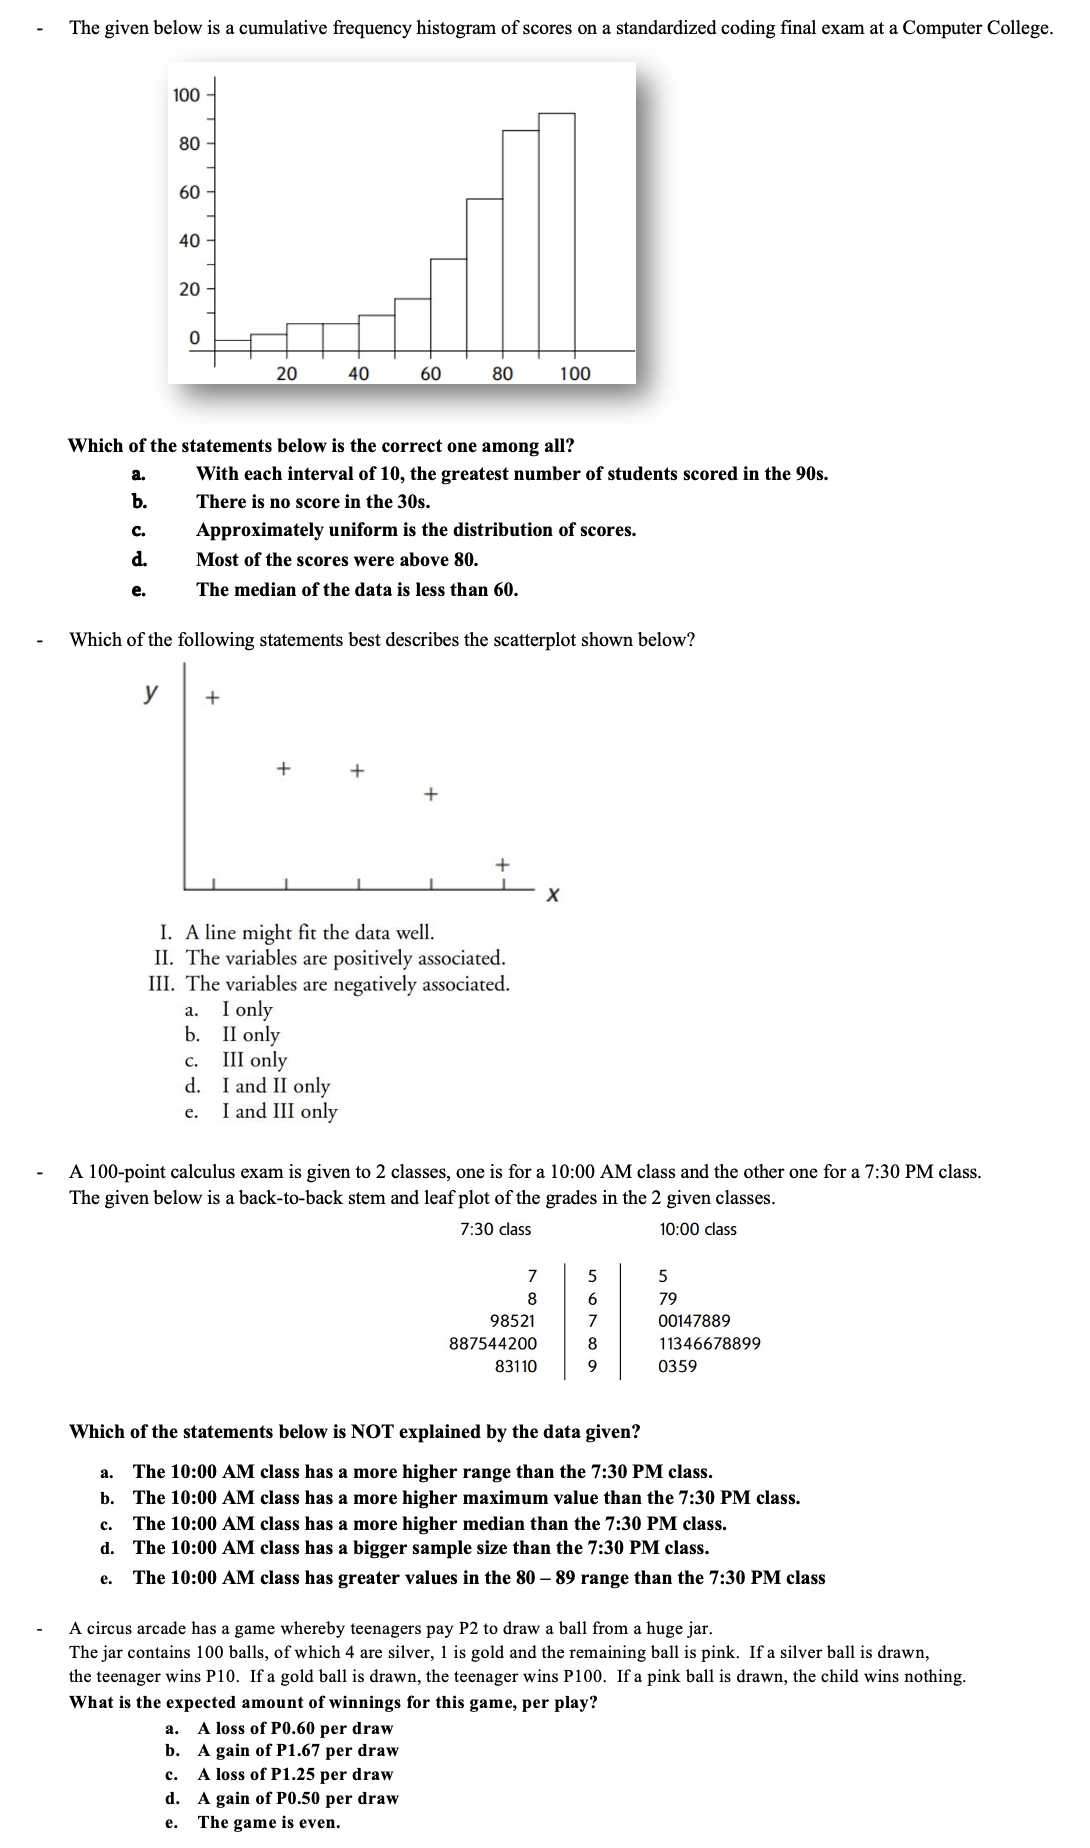
Transcribed Image Text:The given below is a cumulative frequency histogram of scores on a standardized coding final exam at a Computer College.
100
80
60
40
20
20
40
60
80
100
Which of the statements below is the correct one among all?
a.
With each interval of 10, the greatest number of students scored in the 90s.
b.
There is no score in the 30s.
C.
Approximately uniform is the distribution of scores.
d.
Most of the scores were above 80.
е.
The median of the data is less than 60.
Which of the following statements best describes the scatterplot shown below?
y
+
+
I. A line might fit the data well.
II. The variables are positively associated.
III. The variables are negatively associated.
I only
Ь. I only
III only
d. I and II only
I and III only
а.
с.
е.
A 100-point calculus exam is given to 2 classes, one is for a 10:00 AM class and the other one for a 7:30 PM class.
The given below is a back-to-back stem and leaf plot of the grades in the 2 given classes.
7:30 class
10:00 class
7
5
8
79
98521
00147889
887544200
8
11346678899
83110
0359
Which of the statements below is NOT explained by the data given?
The 10:00 AM class has a more higher range than the 7:30 PM class.
а.
b. The 10:00 AM class has a more higher maximum value than the 7:30 PM class.
с.
The 10:00 AM class has a more higher median than the 7:30 PM class.
d. The 10:00 AM class has a bigger sample size than the 7:30 PM class.
The 10:00 AM class has greater values in the 80 – 89 range than the 7:30 PM class
е.
A circus arcade has a game whereby teenagers pay P2 to draw a ball from a huge jar.
The jar contains 100 balls, of which 4 are silver, 1 is gold and the remaining ball is pink. If a silver ball is drawn,
the teenager wins P10. If a gold ball is drawn, the teenager wins P100. If a pink ball is drawn, the child wins nothing.
What is the expected amount of winnings for this game, per play?
a. A loss of PO.60 per draw
b. A gain of P1.67 per draw
A loss of P1.25 per draw
с.
d. A gain of PO.50 per draw
The game is even.
е.
Expert Solution
This question has been solved!
Explore an expertly crafted, step-by-step solution for a thorough understanding of key concepts.

Step by step
Solved in 2 steps

Recommended textbooks for you
Glencoe Algebra 1, Student Edition, 9780079039897…
Algebra
ISBN:
9780079039897
Author:
Carter
Publisher:
McGraw Hill
Glencoe Algebra 1, Student Edition, 9780079039897…
Algebra
ISBN:
9780079039897
Author:
Carter
Publisher:
McGraw Hill