The given sample has a test statistic of -1.5012 The P-value for the test is 0.0688

Holt Mcdougal Larson Pre-algebra: Student Edition 2012
1st Edition
ISBN:9780547587776
Author:HOLT MCDOUGAL
Publisher:HOLT MCDOUGAL
Chapter11: Data Analysis And Probability
Section: Chapter Questions
Problem 15CR

Related questions
Question
Please see below. I just need help with the p value as it is wrong. THE ANSWER IS NOT 0.0688 OR 0.05271
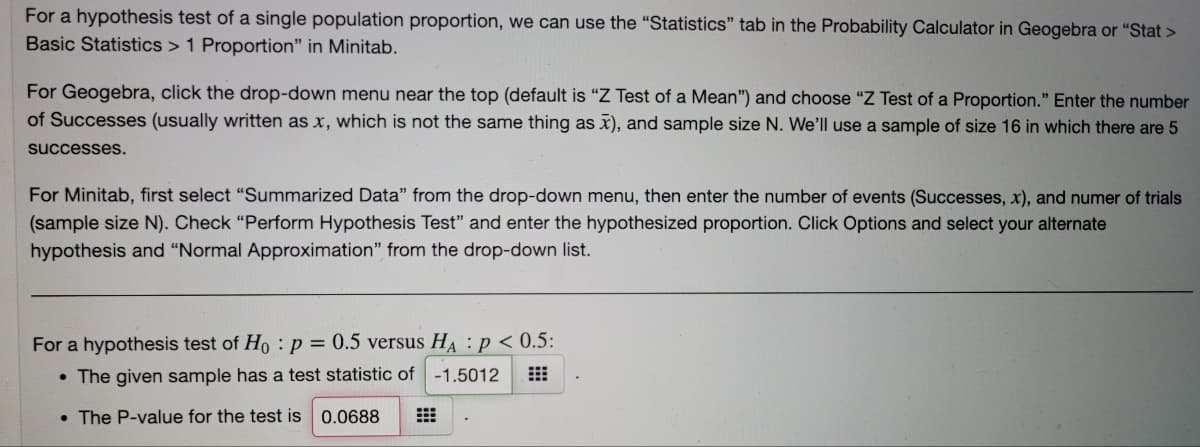
Transcribed Image Text:For a hypothesis test of a single population proportion, we can use the "Statistics" tab in the Probability Calculator in Geogebra or "Stat >
Basic Statistics > 1 Proportion" in Minitab.
For Geogebra, click the drop-down menu near the top (default is "Z Test of a Mean") and choose "Z Test of a Proportion." Enter the number
of Successes (usually written as x, which is not the same thing as x), and sample size N. We'll use a sample of size 16 in which there are 5
successes.
For Minitab, first select "Summarized Data" from the drop-down menu, then enter the number of events (Successes, x), and numer of trials
(sample size N). Check “Perform Hypothesis Test" and enter the hypothesized proportion. Click Options and select your alternate
hypothesis and "Normal Approximation" from the drop-down list.
For a hypothesis test of Ho :p = 0.5 versus HA : p < 0.5:
• The given sample has a test statistic of
-1.5012
• The P-value for the test is 0.0688
Expert Solution
This question has been solved!
Explore an expertly crafted, step-by-step solution for a thorough understanding of key concepts.

Step by step
Solved in 2 steps

Recommended textbooks for you
Holt Mcdougal Larson Pre-algebra: Student Edition…
Algebra
ISBN:
9780547587776
Author:
HOLT MCDOUGAL
Publisher:
HOLT MCDOUGAL


Holt Mcdougal Larson Pre-algebra: Student Edition…
Algebra
ISBN:
9780547587776
Author:
HOLT MCDOUGAL
Publisher:
HOLT MCDOUGAL