The grades are given the fe work, a student at Univer rs of C, and 3 credit hours te the students' GPA
Q: Stationary Matrix Consider an example where a company initially has a 10% market share. Using an…
A: For a provided transition probability matrix P, the state vector π is considered to have attained…
Q: 3 5 6 Estimate the weight of the baby at the age of 4 months. 8 10 12
A:
Q: 2. Sleep habits of College freshmen were investigated. Below are the data gathered on the number of…
A: We have given that, Hours (x) studnets (f) 5 13 6 16 7 28 8 25 9 10 10 8 Then,…
Q: A sample is collected from the items produced by a company. The sample size is 49. The standard…
A: Answer: From the given data, Population standard deviation (σ) = 0.32 Sample size (n) = 49
Q: 5) A maize farmer plans to plant varieties X and Y of maize each in four plots. Illustrate a…
A:
Q: If A and B are two events with P(A) = 2/3, P(B) = 1/5, P(ANB) = 1/15 then Find P(ANB)
A:
Q: K Assume that adults have IQ scores that are normally distributed with a mean of μ= 100 and a…
A: Solution - Given that X denote iq score of adult are normally distributed with mean 100 and…
Q: a) Name the experimental units. b) Name the response variable(s). c) Name the factor(s) or…
A: here we have to find a) Name the experimental units.b) Name the response variable(s).c) Name the…
Q: Use the sample data and confidence level given below to complete parts (a) through (d). A research…
A:
Q: Consider a data set containing the following values: 80, 94, 93, 106, 91, 90, 96, 99 The mean of…
A: Given: n = 8 Mean = 93.625 Formula Used: Sample variance s2 = ∑Xi-X2n-1 Sample standard deviation s…
Q: 4. The time taken to assemble a car in a certain plant is a random variable having a normal…
A:
Q: Classify the following graph as a cross-sectional study or a time-series study. Days at Temperature…
A: Given that We have to find The given graph has cross sectional study or Time series study...
Q: Compute the least-squares regression line for predicting y from x given the following summary…
A: given data x¯ = 6y ¯ = 30.2sx = 2.3sy = 1.8r = 0.40we have to compute least square regression line…
Q: K dogs, each of size n=15, are randomly collected and the sample means are found. Is it correct to…
A: Central limit theorem: If the size of the samples taken from the population are sufficiently…
Q: 0.5 X=1.8 X = 2 S = 0.5 S = Z=
A: Ans#- Given, X¯ = 2, S = 0.5 and X = 1.8 Find Z = ?
Q: A banker finds that the number of times people use automated-teller machines (ATMs) in a year are…
A:
Q: The retirement age of National Football League (NFL) players is Normally distributed with a mean of…
A: Given: Mean μ = 33 Standard deviation σ = 2 Formula Used: Z-score = X-μσ
Q: Use correlation coefficients to determine which of the given sets of data is best fit by its…
A: Given: Dataset 1 x y -1 1 0 2 3 4 Dataset 2 x y -2 -3 0 -1 1 2 Dataset 3…
Q: c) Choose the correct answer below. A. Since the mean and the standard deviation are very close, the…
A: It is given that Mean = $89930 Median = $59039 Standard deviation = $85000
Q: Stocks may be categorized by industry. The accompanying data represent three-year rates of return…
A: The data shows the three-year rates of returns for a sample of financial stocks.
Q: In a survey of 1500 Filipinos, 15% said they believed in horoscope. Calculate a two-sided confidence…
A: Givensample size(n)=1500sample proportion(p^)=0.15confidence level=99%
Q: 2. If a stock price went from $100 to $110 per share in a year, what was its annual rate of return?…
A:
Q: Suppose that Y₁, Y₂,..., Y is a random sample of size m from Gamma (a = 3,ß= 0), where 8 is not…
A:
Q: The probability distribution for the random variable x is X : 3, 3.5, 4.0, 4.5, 5.0, 5.5 and…
A: Given;probability distribution function P(X) for the random variable X is: X 3 3.5 4 4.5 5 5.5…
Q: #1 only
A: Given that p = 0.02 p : probability of connecting a call X ~ Geometric(p = 0.02) Probability mass…
Q: and
A: Response variable : It is also referred to as an outcome or a dependent variable. In simple words,…
Q: In a specific year, SAT scores were Normally distributed with mean 1026 and standard deviation 209;…
A:
Q: (c) Estimate the percentage of amounts that were between $42.92 and $45.75, Round the answer to one…
A:
Q: Conside the probabiliy distribuiton below x probability p(x) 7.6 0.5 8.4 0.5 what is the standard…
A: We have given that, Let X be the random variable having probability distribution is, X P(X)…
Q: Here is a data set (n 117) that has been sorted. 20.5 22.6 24.5 25 25.2 26 27 27.8 28 28.5 28.5 29…
A: From the provided information, Number of observations (n) = 117
Q: 26 randomly selected students were asked the number of movies they watched the previous week. The…
A: The data shows the number of movies they watched in the previous week of 26 randomly selected…
Q: For the distribution shown, which letter represents the mode? (This is a reading assessment…
A: We know This graph consist 2 axis( x and y) Three measures ( mean, median, mode) X- axis represent…
Q: Each of the variables described below, indicate whether it is a quantitative or a categorical…
A: Identify the variable type of variable and level of measurement
Q: 5. The grade point average (GPA) for college students is based on a weighted mean computation. For…
A: Given Grades are given the following data values: A(4), B(3), C(2), D(1) and F(0) A student earned 9…
Q: Y 1234 X1 10 8 14 9 X2 806 10 10 X3 12 10 12 7
A: Data given Y: 1,2,3,4 X1:10,8,14,9 X2:8,6,10,10 X3:12,10,12,7
Q: ■ Among a sample of 5 workers the hourly wages $16, $18, and $19. ■ What's the sample standard…
A: We have given that, Sample of 5 workers the hourly wages are : X : 12, 20, 16, 18, 19 Then, We…
Q: There is a high possibility that the mode may not be defined for (Select the best answer) A.…
A: There are two types of variable they are continuous and discrete random variable. Continuous random…
Q: Categories of Books Sold Travel 30.1% Science Fiction 13.2 %
A: The pie chart is given. The total books are sold each month is 5400
Q: (a) If you draw 5 cards, one at a time, placing each card back into the deck and shuffling before…
A: Here given , An iteration of the board game Candyland has the following cards: 6 each of red,…
Q: #2 only in 20 mins
A: Given that: Total number of components, n=100 Probability of success, p=0.02
Q: Compute the mean and variance for the linear function W = 2X - 4Y.
A: It is given that For X, mean = 1.3, Variance = 0.21 For Y, mean = 0.3, Variance = 0.21 Cov(X, Y) =…
Q: An arithmetic cash flow gradient series equals $500 in year 1, $600 in year 2, and amounts…
A: Answer..
Q: In a survey of 1500 Filipinos, 15% said they believed in horoscope. Calculate a two-sided confidence…
A: Given length of CI=0.05 , p^=sample proportion=p^=0.15 Level of significance ɑ=0.01
Q: Centipedes vary in the number of segments that they possess. A biologist measures segment number…
A: There are two types of variables, they are quantitative and qualitative. Quantitative variable are…
Q: In a study of government financial aid for college students, it becomes necessary to estimate the…
A: From the provided information, Margin of error (E) = 0.03 Confidence level = 99%
Q: A teacher has a jar that contains his students names: Maria, Jenna, Boyd, Melinda, Brett, Jacob,…
A: Since you have posted a question with multiple sub-parts, we will solve first three subparts for…
Q: 60 randomly selected students were asked the number of pairs of shoes they have. Let X represent the…
A: Since you have posted a question with multiple subparts, we will solve first three subparts for you.…
Q: Find the 94th percentile, P94, from the following data 1000 1100 1400 1500 1600 1800 1900 2000…
A: Given,sample size(n)=35the given data is already arranged in ascending order.
Q: The following data represent the number of people aged 25 to 64 years covered by health insurance…
A: The data shows the number of people aged 25 to 64 years covered by health insurance in 2018.
Q: Another measure of central tendency is the trimmed mean. It is computed by determining the mean of a…
A: We have given data are…
DO THIS TYPEWRITTEN FOR UPVOTE
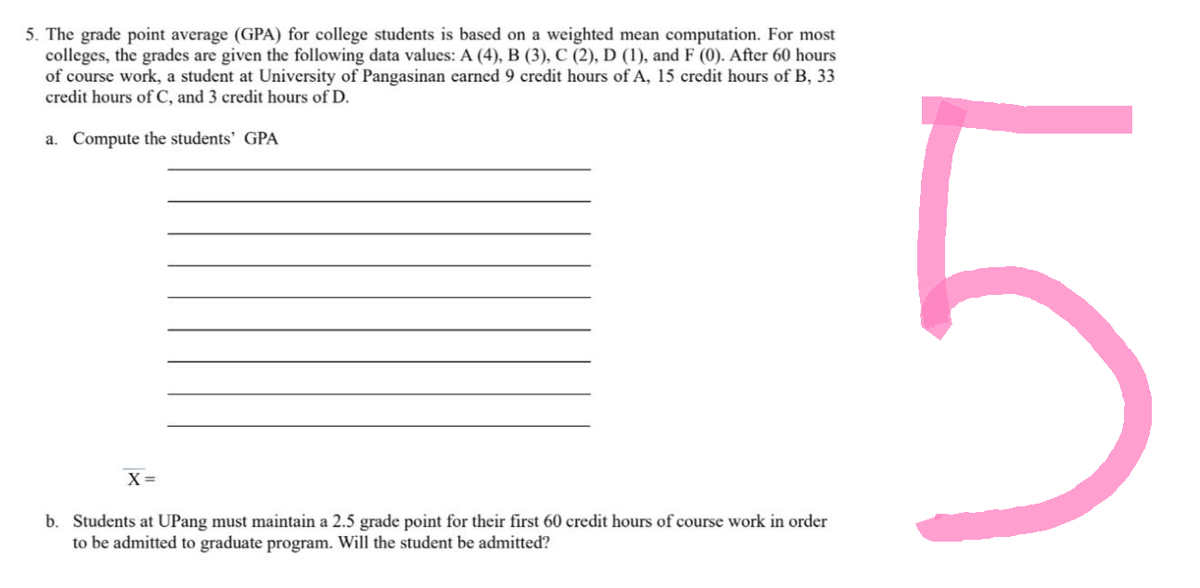
Step by step
Solved in 2 steps