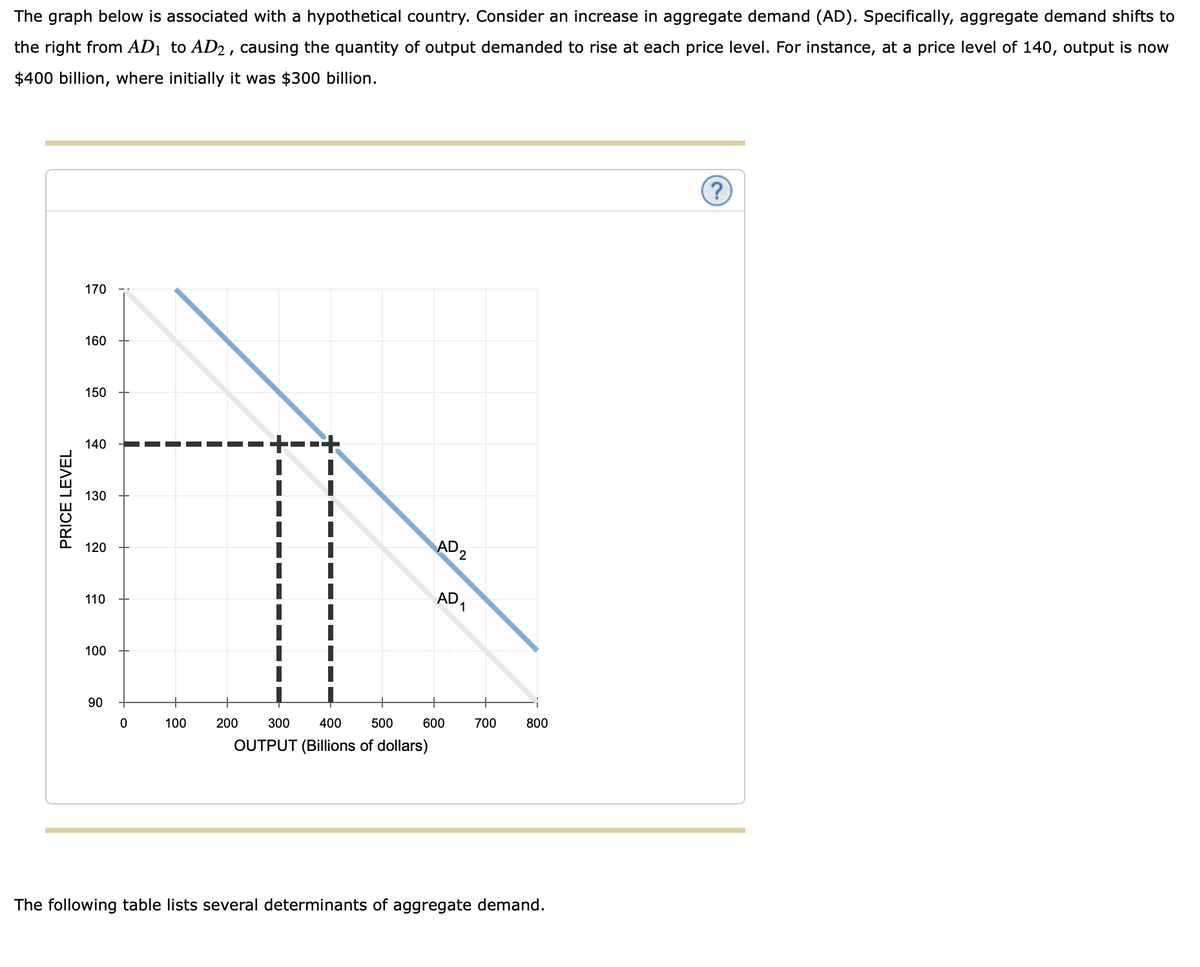
The graph below is associated with a hypothetical country. Consider an increase in aggregate demand (AD). Specifically, aggregate demand shifts to the right from AD1AD1 to AD2AD2, causing the quantity of output demanded to rise at each price level. For instance, at a price level of 140, output is now $400 billion, where initially it was $300 billion. Fill in the missing values in the table by selecting the change in each scenario required to increase aggregate demand. Change required to increase AD Expected rate of return on investment. (decrease/increase) Incomes in other countries (decrease/increase) Consumer expectations about future profitability. (improve/worsen) Government spending (increase/decrease)


The graph below is associated with a hypothetical country. Consider an increase in aggregate
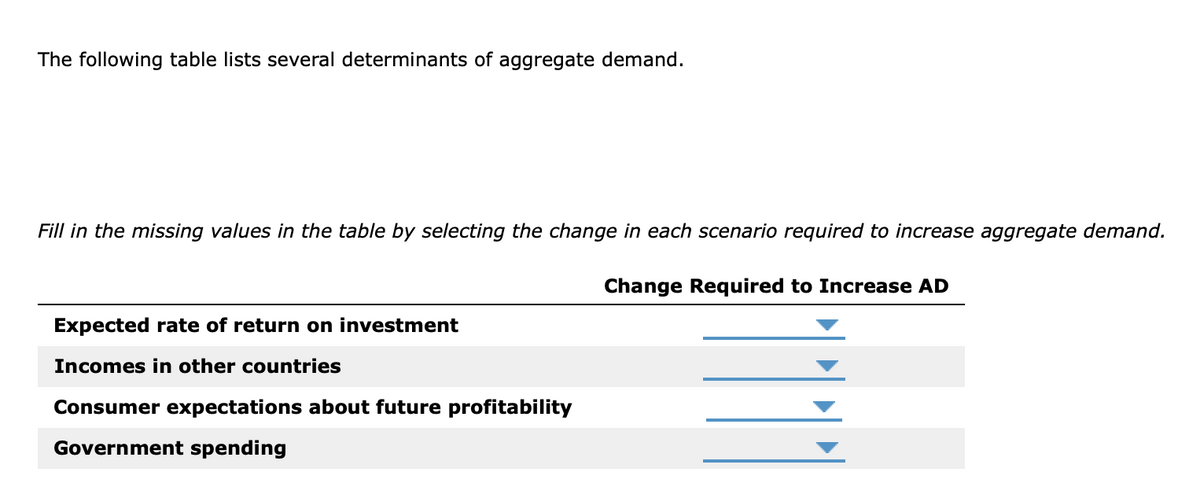
Fill in the missing values in the table by selecting the change in each scenario required to increase aggregate demand.
Change required to increase AD
Expected rate of
Incomes in other countries (decrease/increase)
Consumer expectations about future profitability. (improve/worsen)
Government spending (increase/decrease)


Trending now
This is a popular solution!

Step by step
Solved in 3 steps


