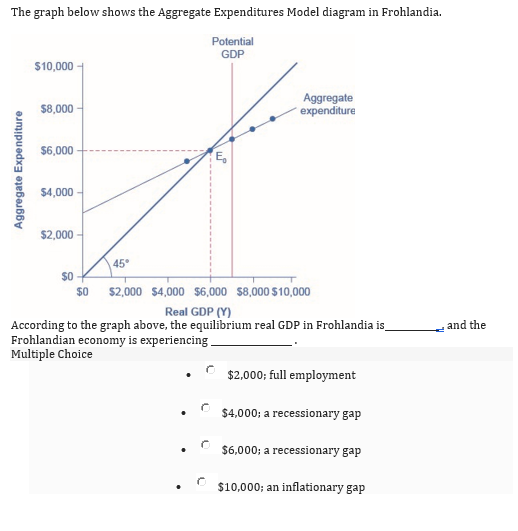
The graph below shows the Aggregate Expenditures Model diagram in Frohlandia. Potential GDP $10,000 $8,000- Aggregate expenditure $6,000 E₂ $4,000 $2,000 45° $0 $0 $2,000 $4,000 $6,000 $8,000 $10,000 Real GDP (Y) According to the graph above, the equilibrium real GDP in Frohlandia is_ Frohlandian economy is experiencing. Multiple Choice $2,000; full employment $4,000; a recessionary gap $6,000; a recessionary gap $10,000; an inflationary gap Aggregate Expenditure and the
The graph below shows the Aggregate Expenditures Model diagram in Frohlandia. Potential GDP $10,000 $8,000- Aggregate expenditure $6,000 E₂ $4,000 $2,000 45° $0 $0 $2,000 $4,000 $6,000 $8,000 $10,000 Real GDP (Y) According to the graph above, the equilibrium real GDP in Frohlandia is_ Frohlandian economy is experiencing. Multiple Choice $2,000; full employment $4,000; a recessionary gap $6,000; a recessionary gap $10,000; an inflationary gap Aggregate Expenditure and the

Chapter9: Demand-side Equilibrium: Unemployment Or Inflation?
Section9.A: The Simple Algebra Of Income Determination And The Multiplier
Problem 4TY

Related questions
Question
100%
Transcribed Image Text:The graph below shows the Aggregate Expenditures Model diagram in Frohlandia.
Potential
GDP
$10,000
$8,000
Aggregate
expenditure
$6,000
$4,000
$2,000
$0
Aggregate Expenditure
45°
$0
$2,000 $4,000 $6,000 $8,000 $10,000
Real GDP (Y)
According to the graph above, the equilibrium real GDP in Frohlandia is
Frohlandian economy is experiencing
Multiple Choice
$2,000; full employment
.
$4,000; a recessionary gap
.
$6,000; a recessionary gap
$10,000; an inflationary gap
0
and the
Expert Solution
This question has been solved!
Explore an expertly crafted, step-by-step solution for a thorough understanding of key concepts.

This is a popular solution!

Trending now
This is a popular solution!

Step by step
Solved in 2 steps

Knowledge Booster


Learn more about
Need a deep-dive on the concept behind this application? Look no further. Learn more about this topic, economics and related others by exploring similar questions and additional content below.Recommended textbooks for you


Macroeconomics: Principles and Policy (MindTap Co…
Economics
ISBN:
9781305280601
Author:
William J. Baumol, Alan S. Blinder
Publisher:
Cengage Learning