The graph below shows the cost curve phases occurring during the process of the technology treadmill when there is a fixed government price. Using the graph, answer the questions below. Price 105 ● * શ્રુ છુ ૩ 95 85 70 65 60 55 50 45 40 35 30 25 20 15 10 5 0 0 5 10 15 20 25 30 Quantity 35 40 45 50 55 Guaranteed price = Label the graphs #1, #2, #3, #4 & #5 based on the order of the changes that happen when a firm adopts a technology (from the initial technology) and expands her operation up to the point where there is no need to further expand. Draw the initial guaranteed market price if the government establishes wants to ensure zero economic profit based on the original technology. Write the value below the graph in the space provided. When firms start competing for land and it results in an increase in land prices, show what happens to the cost curves of the grower who adopted the technology but did not expand her operation. Do this by carefully drawing any resulting shifts of the graphs or using any existing graph and indicating which of those graphs is the correct one (using the labels you attached).
The graph below shows the cost curve phases occurring during the process of the technology treadmill when there is a fixed government price. Using the graph, answer the questions below. Price 105 ● * શ્રુ છુ ૩ 95 85 70 65 60 55 50 45 40 35 30 25 20 15 10 5 0 0 5 10 15 20 25 30 Quantity 35 40 45 50 55 Guaranteed price = Label the graphs #1, #2, #3, #4 & #5 based on the order of the changes that happen when a firm adopts a technology (from the initial technology) and expands her operation up to the point where there is no need to further expand. Draw the initial guaranteed market price if the government establishes wants to ensure zero economic profit based on the original technology. Write the value below the graph in the space provided. When firms start competing for land and it results in an increase in land prices, show what happens to the cost curves of the grower who adopted the technology but did not expand her operation. Do this by carefully drawing any resulting shifts of the graphs or using any existing graph and indicating which of those graphs is the correct one (using the labels you attached).

Microeconomics: Principles & Policy
14th Edition
ISBN:9781337794992
Author:William J. Baumol, Alan S. Blinder, John L. Solow
Publisher:William J. Baumol, Alan S. Blinder, John L. Solow
Chapter18: Pricing The Factors Of Production
Section: Chapter Questions
Problem 2TY

Related questions
Question
5 the graph below shows the cost curve phases occurring during the process of the technology treadmill when there is a fixed government price . Using the graph answer the questions below
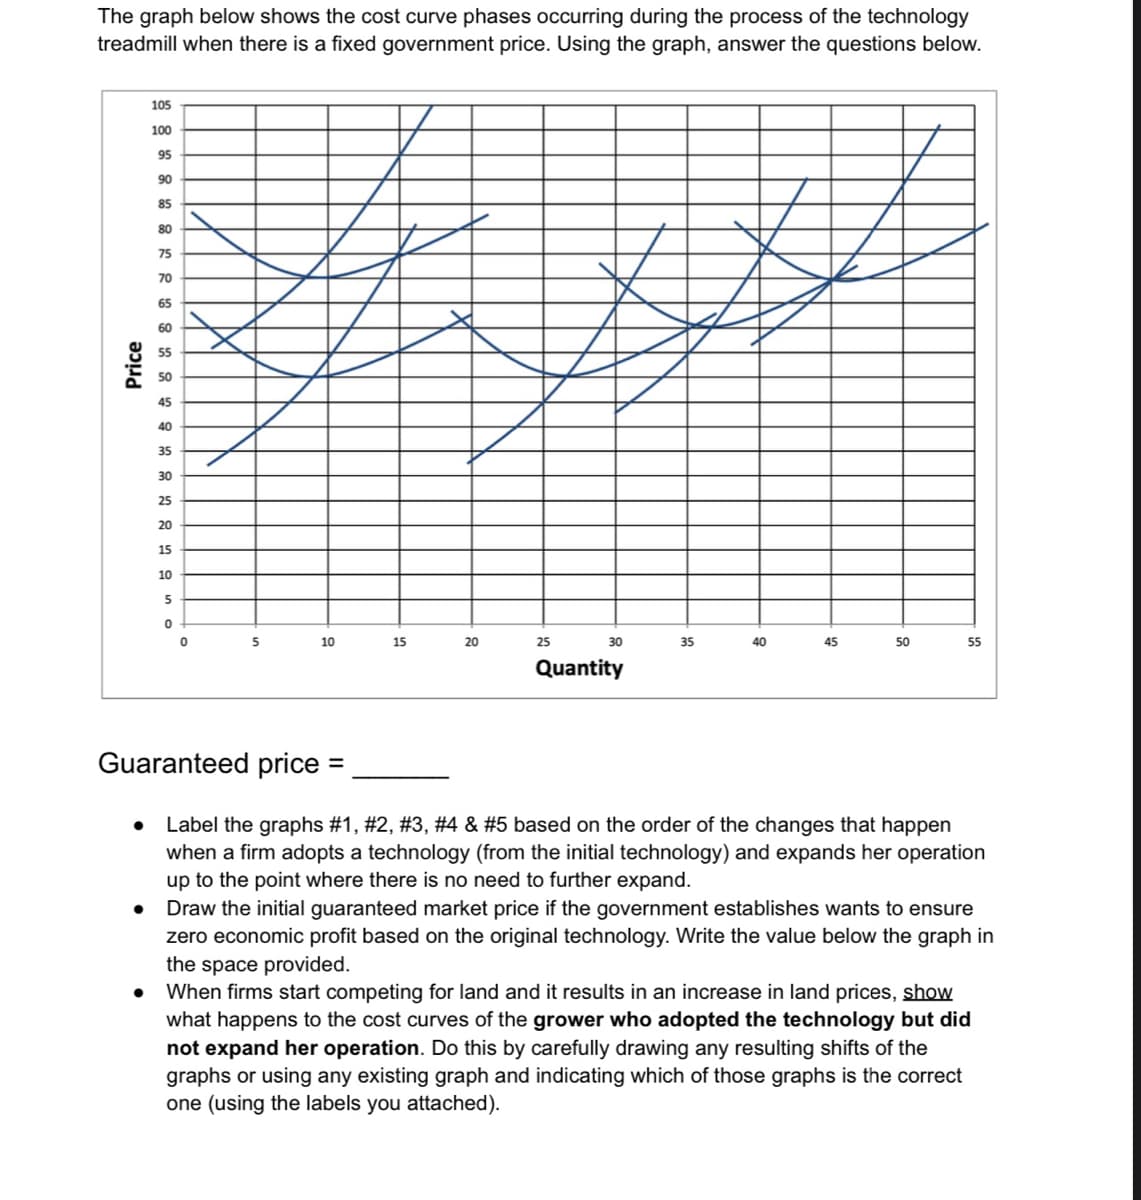
Transcribed Image Text:The graph below shows the cost curve phases occurring during the process of the technology
treadmill when there is a fixed government price. Using the graph, answer the questions below.
Price
105
100
95
90
85
80
75
70
●
65
60
55
50
45
40
35
30
25
20
15
10
5
0
0
5
10
15
20
25
30
Quantity
#
35
40
45
50
55
Guaranteed price
Label the graphs #1, #2, #3, #4 & #5 based on the order of the changes that happen
when a firm adopts a technology (from the initial technology) and expands her operation
up to the point where there is no need to further expand.
Draw the initial guaranteed market price if the government establishes wants to ensure
zero economic profit based on the original technology. Write the value below the graph in
the space provided.
When firms start competing for land and it results in an increase in land prices, show
what happens to the cost curves of the grower who adopted the technology but did
not expand her operation. Do this by carefully drawing any resulting shifts of the
graphs or using any existing graph and indicating which of those graphs is the correct
one (using the labels you attached).
Expert Solution
This question has been solved!
Explore an expertly crafted, step-by-step solution for a thorough understanding of key concepts.

Step by step
Solved in 4 steps with 3 images

Knowledge Booster


Learn more about
Need a deep-dive on the concept behind this application? Look no further. Learn more about this topic, economics and related others by exploring similar questions and additional content below.Recommended textbooks for you
Microeconomics: Principles & Policy
Economics
ISBN:
9781337794992
Author:
William J. Baumol, Alan S. Blinder, John L. Solow
Publisher:
Cengage Learning
Microeconomics: Principles & Policy
Economics
ISBN:
9781337794992
Author:
William J. Baumol, Alan S. Blinder, John L. Solow
Publisher:
Cengage Learning