The graph below shows the (fictitious) relationship between the natural log of juvenile survival versus individual inbreeding coefficient for two isolated populations from the same species. The relationship is shown by a red line for isolated population 1 and by a blue line for isolated population 2. Natural log juvenile survival 0 B = -2.2 B = -4.5 0.25 0.5 Inbreeding coefficient 0.75 1
The graph below shows the (fictitious) relationship between the natural log of juvenile survival versus individual inbreeding coefficient for two isolated populations from the same species. The relationship is shown by a red line for isolated population 1 and by a blue line for isolated population 2. Natural log juvenile survival 0 B = -2.2 B = -4.5 0.25 0.5 Inbreeding coefficient 0.75 1

Human Anatomy & Physiology (11th Edition)
11th Edition
ISBN:9780134580999
Author:Elaine N. Marieb, Katja N. Hoehn
Publisher:Elaine N. Marieb, Katja N. Hoehn
Chapter1: The Human Body: An Orientation
Section: Chapter Questions
Problem 1RQ: The correct sequence of levels forming the structural hierarchy is A. (a) organ, organ system,...

Related questions

Question
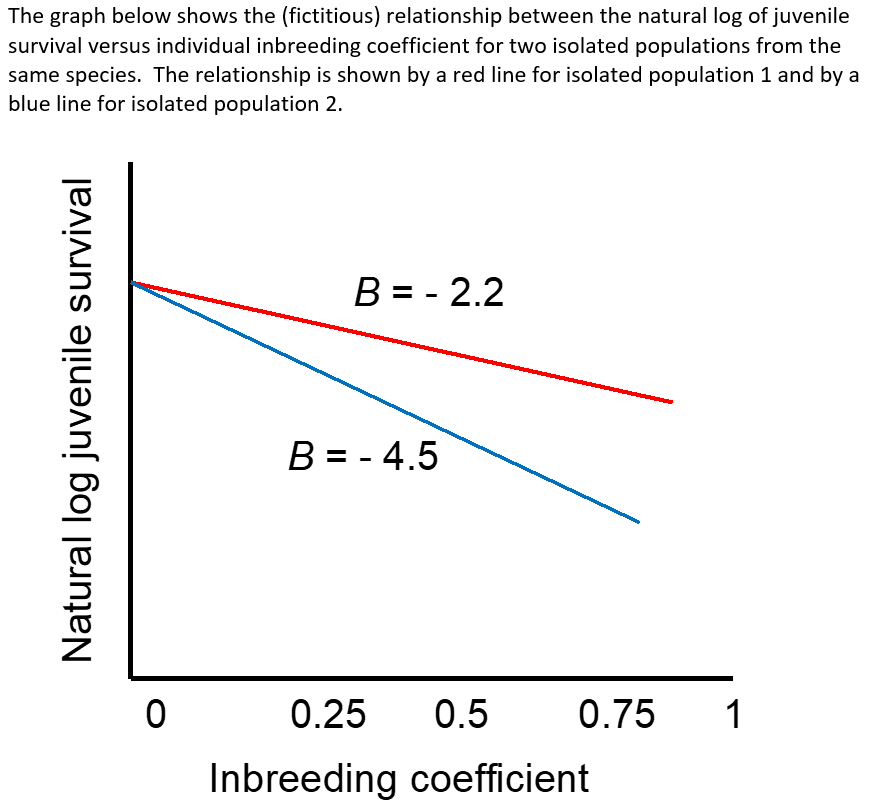
Transcribed Image Text:The graph below shows the (fictitious) relationship between the natural log of juvenile
survival versus individual inbreeding coefficient for two isolated populations from the
same species. The relationship is shown by a red line for isolated population 1 and by a
blue line for isolated population 2.
B = - 2.2
B = - 4.5
0.25
0.5
0.75
1
Inbreeding coefficient
Natural log juvenile survival
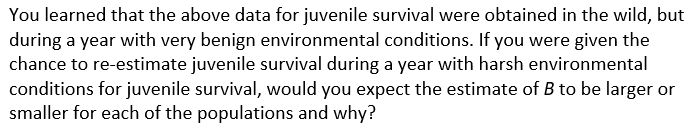
Transcribed Image Text:You learned that the above data for juvenile survival were obtained in the wild, but
during a year with very benign environmental conditions. If you were given the
chance to re-estimate juvenile survival during a year with harsh environmental
conditions for juvenile survival, would you expect the estimate of B to be larger or
smaller for each of the populations and why?
Expert Solution
This question has been solved!
Explore an expertly crafted, step-by-step solution for a thorough understanding of key concepts.

Step by step
Solved in 3 steps

Knowledge Booster


Learn more about
Need a deep-dive on the concept behind this application? Look no further. Learn more about this topic, biology and related others by exploring similar questions and additional content below.Recommended textbooks for you
Human Anatomy & Physiology (11th Edition)
Biology
ISBN:
9780134580999
Author:
Elaine N. Marieb, Katja N. Hoehn
Publisher:
PEARSON

Biology 2e
Biology
ISBN:
9781947172517
Author:
Matthew Douglas, Jung Choi, Mary Ann Clark
Publisher:
OpenStax

Anatomy & Physiology
Biology
ISBN:
9781259398629
Author:
McKinley, Michael P., O'loughlin, Valerie Dean, Bidle, Theresa Stouter
Publisher:
Mcgraw Hill Education,
Human Anatomy & Physiology (11th Edition)
Biology
ISBN:
9780134580999
Author:
Elaine N. Marieb, Katja N. Hoehn
Publisher:
PEARSON
Biology 2e
Biology
ISBN:
9781947172517
Author:
Matthew Douglas, Jung Choi, Mary Ann Clark
Publisher:
OpenStax
Anatomy & Physiology
Biology
ISBN:
9781259398629
Author:
McKinley, Michael P., O'loughlin, Valerie Dean, Bidle, Theresa Stouter
Publisher:
Mcgraw Hill Education,

Molecular Biology of the Cell (Sixth Edition)
Biology
ISBN:
9780815344322
Author:
Bruce Alberts, Alexander D. Johnson, Julian Lewis, David Morgan, Martin Raff, Keith Roberts, Peter Walter
Publisher:
W. W. Norton & Company

Laboratory Manual For Human Anatomy & Physiology
Biology
ISBN:
9781260159363
Author:
Martin, Terry R., Prentice-craver, Cynthia
Publisher:
McGraw-Hill Publishing Co.

Inquiry Into Life (16th Edition)
Biology
ISBN:
9781260231700
Author:
Sylvia S. Mader, Michael Windelspecht
Publisher:
McGraw Hill Education