The graph below shows the price of a bushel of a certain crop over a span of 9 years. In what year was the rate of price increase the least? 9.65 1.65 1 2 3 4 5 6 7 8 9 x time (years) price (dollars)
The graph below shows the price of a bushel of a certain crop over a span of 9 years. In what year was the rate of price increase the least? 9.65 1.65 1 2 3 4 5 6 7 8 9 x time (years) price (dollars)

Chapter4: Linear Functions
Section4.3: Fitting Linear Models To Data
Problem 23SE: The US. import of wine (in hectoliters) for several years is given in Table 5. Determine whether the...

Related questions
Question
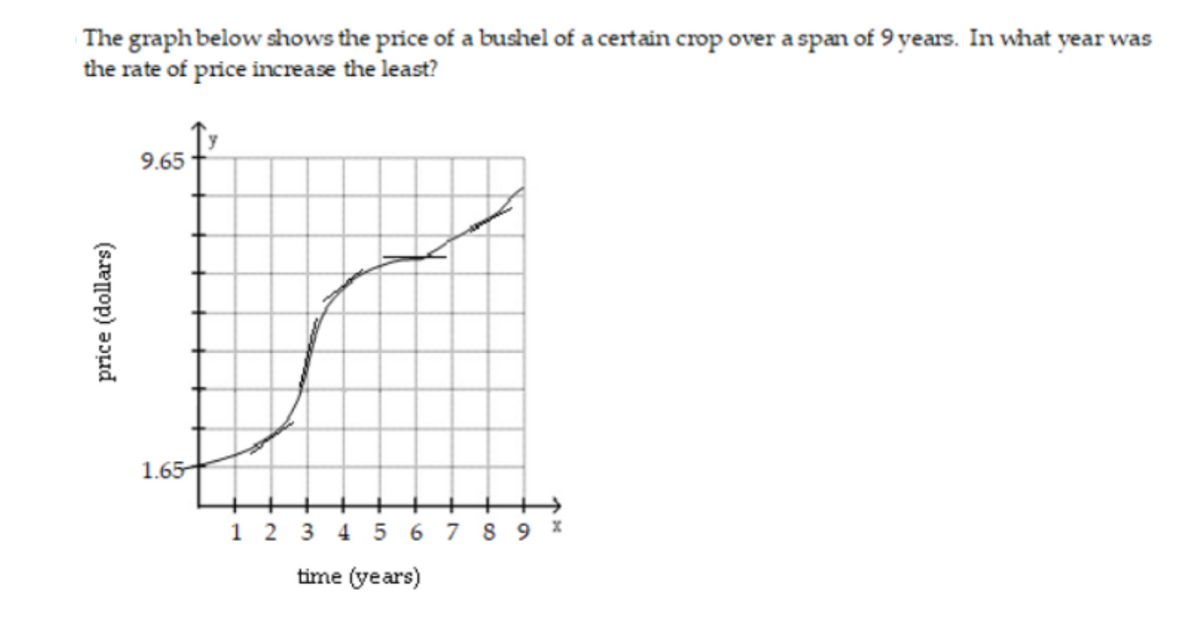
Transcribed Image Text:The graph below shows the price of a bushel of a certain crop over a span of 9 years. In what year was
the rate of price increase the least?
9.65
1.65
1 2 3 4 5 6 7 8 9 x
time (years)
price (dollars)
Expert Solution
This question has been solved!
Explore an expertly crafted, step-by-step solution for a thorough understanding of key concepts.

Step by step
Solved in 2 steps

Recommended textbooks for you

Glencoe Algebra 1, Student Edition, 9780079039897…
Algebra
ISBN:
9780079039897
Author:
Carter
Publisher:
McGraw Hill

Big Ideas Math A Bridge To Success Algebra 1: Stu…
Algebra
ISBN:
9781680331141
Author:
HOUGHTON MIFFLIN HARCOURT
Publisher:
Houghton Mifflin Harcourt
Glencoe Algebra 1, Student Edition, 9780079039897…
Algebra
ISBN:
9780079039897
Author:
Carter
Publisher:
McGraw Hill
Big Ideas Math A Bridge To Success Algebra 1: Stu…
Algebra
ISBN:
9781680331141
Author:
HOUGHTON MIFFLIN HARCOURT
Publisher:
Houghton Mifflin Harcourt

Functions and Change: A Modeling Approach to Coll…
Algebra
ISBN:
9781337111348
Author:
Bruce Crauder, Benny Evans, Alan Noell
Publisher:
Cengage Learning

College Algebra (MindTap Course List)
Algebra
ISBN:
9781305652231
Author:
R. David Gustafson, Jeff Hughes
Publisher:
Cengage Learning

Holt Mcdougal Larson Pre-algebra: Student Edition…
Algebra
ISBN:
9780547587776
Author:
HOLT MCDOUGAL
Publisher:
HOLT MCDOUGAL