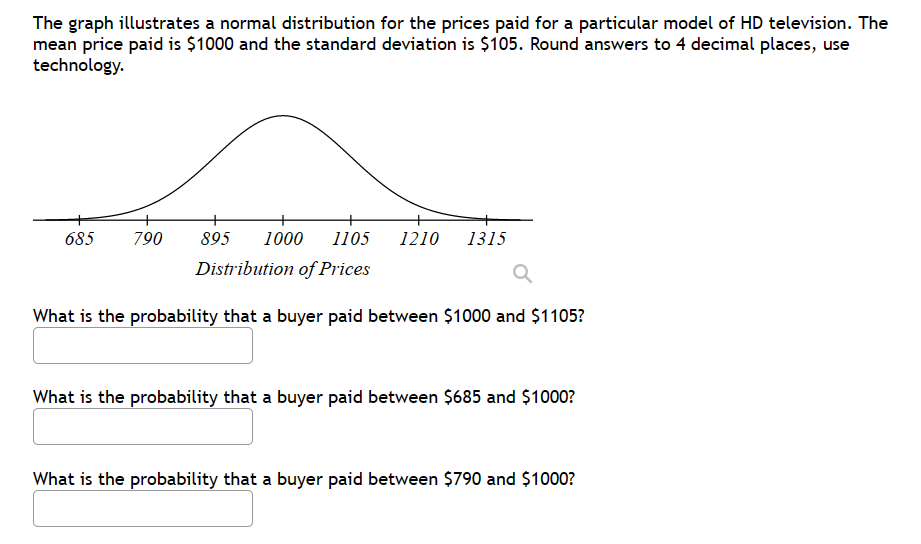
The graph illustrates a normal distribution for the prices paid for a particular model of HD television. The mean price paid is $1000 and the standard deviation is $105. Round answers to 4 decimal places, use technology. 790 895 1000 1105 1210 1315 Distribution of Prices What is the probability that a buyer paid between $1000 and $1105? 685 What is the probability that a buyer paid between $685 and $1000? What is the probability that a buyer paid between $790 and $1000?
The graph illustrates a normal distribution for the prices paid for a particular model of HD television. The mean price paid is $1000 and the standard deviation is $105. Round answers to 4 decimal places, use technology. 790 895 1000 1105 1210 1315 Distribution of Prices What is the probability that a buyer paid between $1000 and $1105? 685 What is the probability that a buyer paid between $685 and $1000? What is the probability that a buyer paid between $790 and $1000?

Glencoe Algebra 1, Student Edition, 9780079039897, 0079039898, 2018
18th Edition
ISBN:9780079039897
Author:Carter
Publisher:Carter
Chapter10: Statistics
Section10.4: Distributions Of Data
Problem 19PFA

Related questions
Question
Transcribed Image Text:The graph illustrates a normal distribution for the prices paid for a particular model of HD television. The
mean price paid is $1000 and the standard deviation is $105. Round answers to 4 decimal places, use
technology.
685
790 895 1000 1105
Distribution of Prices
What is the probability that a buyer paid between $1000 and $1105?
1210 1315
What is the probability that a buyer paid between $685 and $1000?
What is the probability that a buyer paid between $790 and $1000?
Expert Solution
This question has been solved!
Explore an expertly crafted, step-by-step solution for a thorough understanding of key concepts.

This is a popular solution!

Trending now
This is a popular solution!

Step by step
Solved in 2 steps

Recommended textbooks for you
Glencoe Algebra 1, Student Edition, 9780079039897…
Algebra
ISBN:
9780079039897
Author:
Carter
Publisher:
McGraw Hill
Glencoe Algebra 1, Student Edition, 9780079039897…
Algebra
ISBN:
9780079039897
Author:
Carter
Publisher:
McGraw Hill