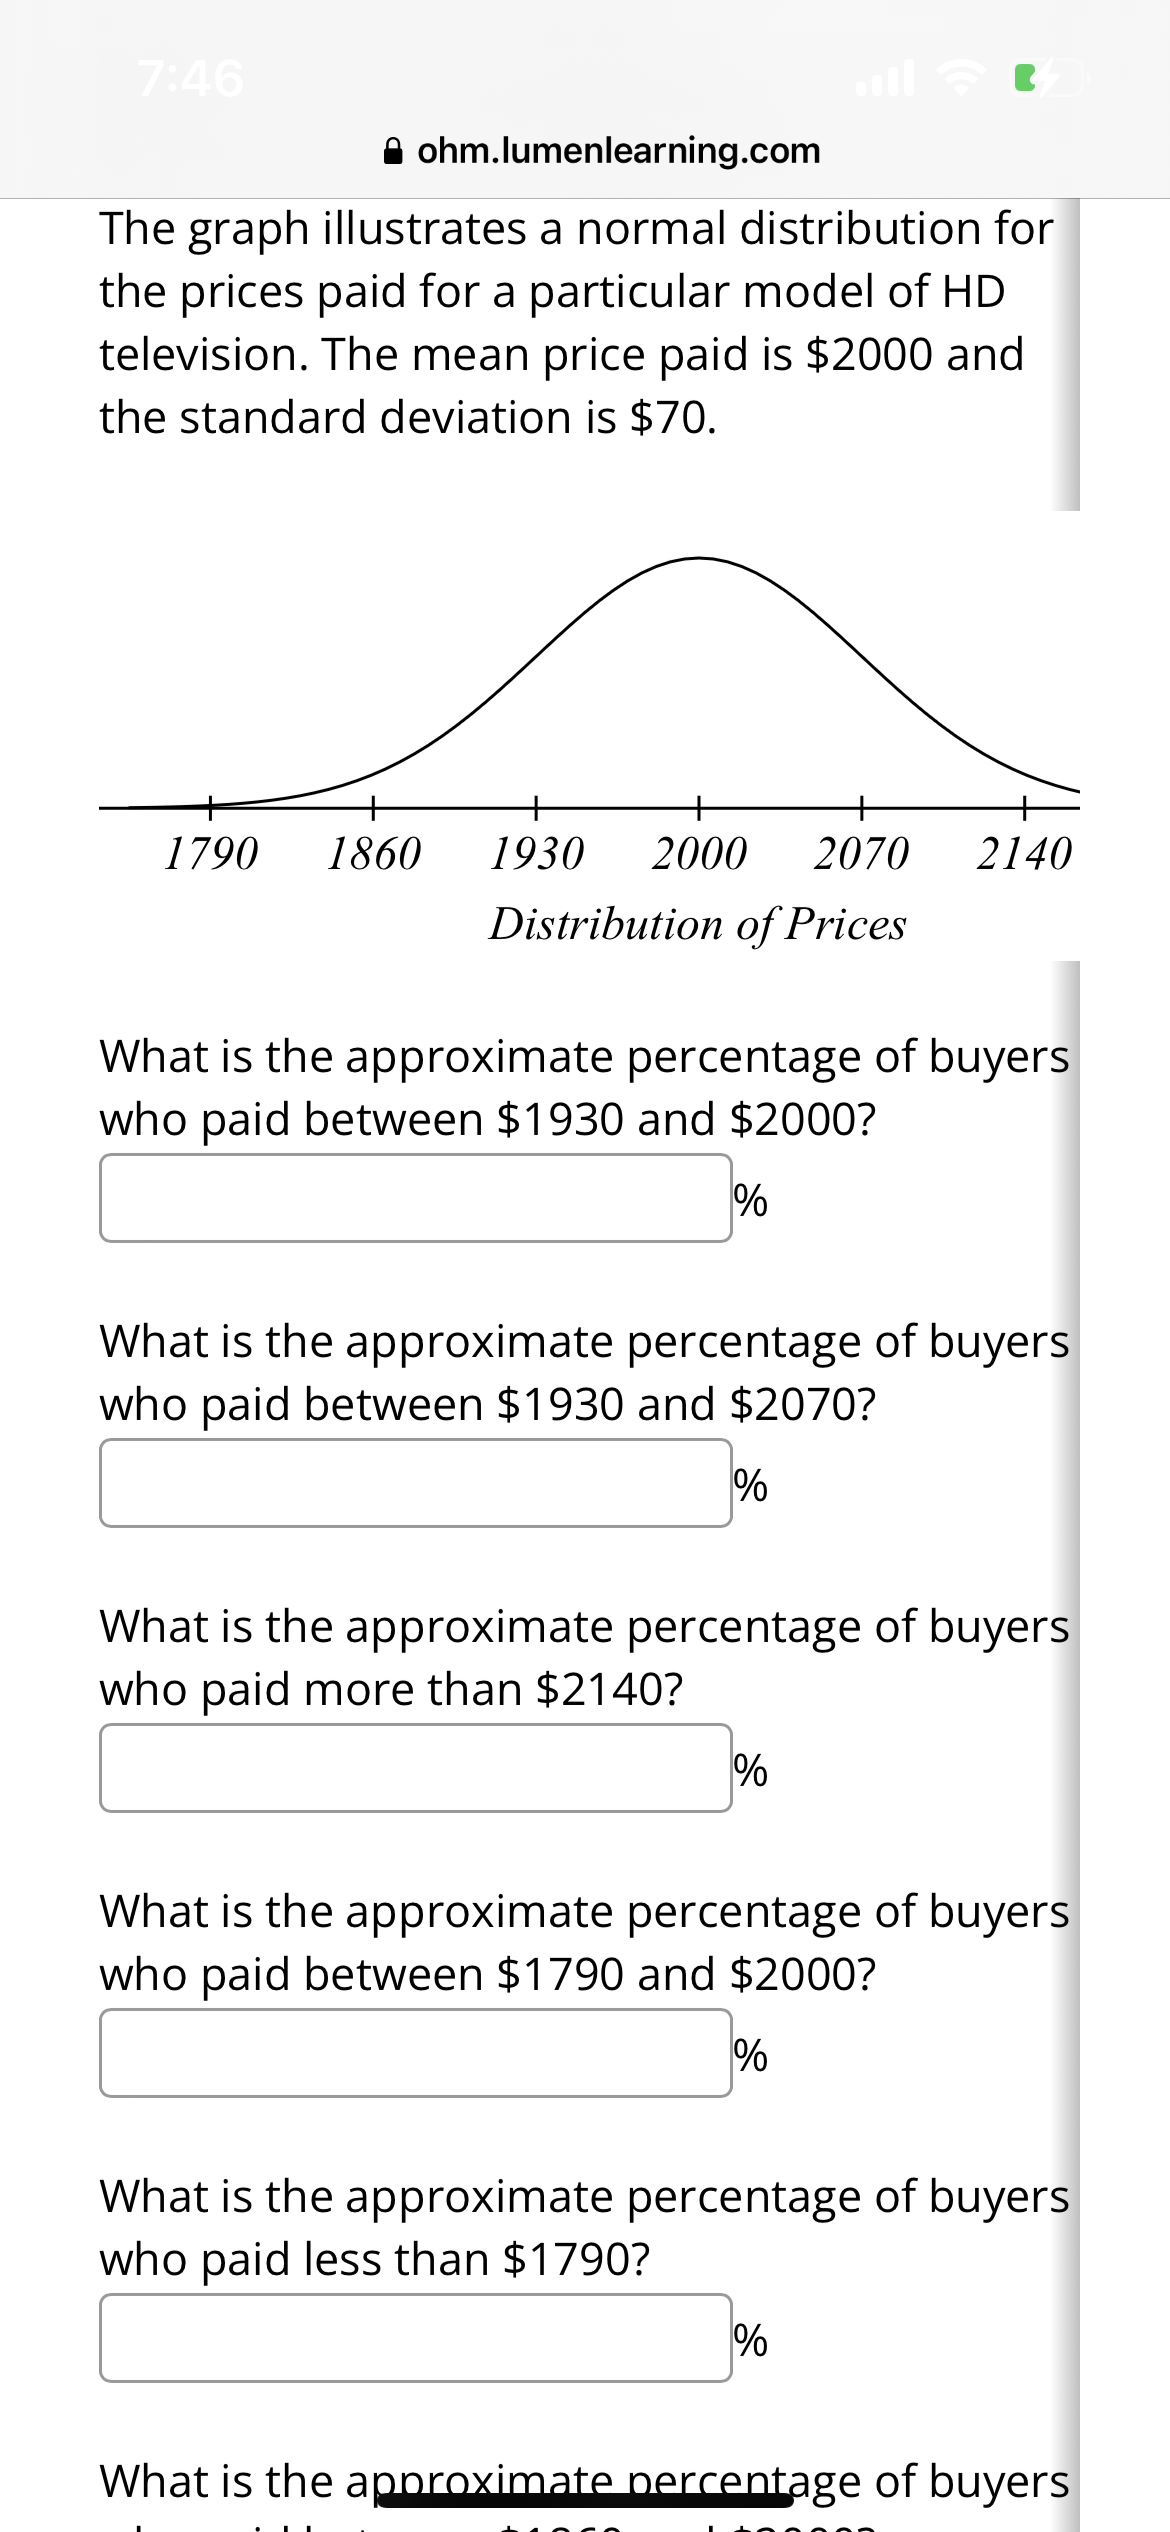
The graph illustrates a normal distribution for the prices paid for a particular model of HD television. The mean price paid is $2000 and the standard deviation is $70. 1790 1860 1930 2000 2070 2140 Distribution of Prices What is the approximate percentage of buyers who paid between $1930 and $2000? % What is the approximate percentage of buyers who paid between $1930 and $2070? % What is the approximate percentage of buyers who paid more than $2140? % What is the approximate percentage of buyers who paid between $1790 and $2000?
The graph illustrates a normal distribution for the prices paid for a particular model of HD television. The mean price paid is $2000 and the standard deviation is $70. 1790 1860 1930 2000 2070 2140 Distribution of Prices What is the approximate percentage of buyers who paid between $1930 and $2000? % What is the approximate percentage of buyers who paid between $1930 and $2070? % What is the approximate percentage of buyers who paid more than $2140? % What is the approximate percentage of buyers who paid between $1790 and $2000?

Glencoe Algebra 1, Student Edition, 9780079039897, 0079039898, 2018
18th Edition
ISBN:9780079039897
Author:Carter
Publisher:Carter
Chapter10: Statistics
Section10.3: Measures Of Spread
Problem 26PFA

Related questions
Question
Transcribed Image Text:7:46
ohm.lumenlearning.com
The graph illustrates a normal distribution for
the prices paid for a particular model of HD
television. The mean price paid is $2000 and
the standard deviation is $70.
1790 1860
1930 2000 2070 2140
Distribution of Prices
What is the approximate percentage of buyers
who paid between $1930 and $2000?
%
What is the approximate percentage of buyers
who paid between $1930 and $2070?
%
What is the approximate percentage of buyers
who paid more than $2140?
%
What is the approximate percentage of buyers
who paid between $1790 and $2000?
%
What is the approximate percentage of buyers
who paid less than $1790?
%
What is the approximate percentage of buyers
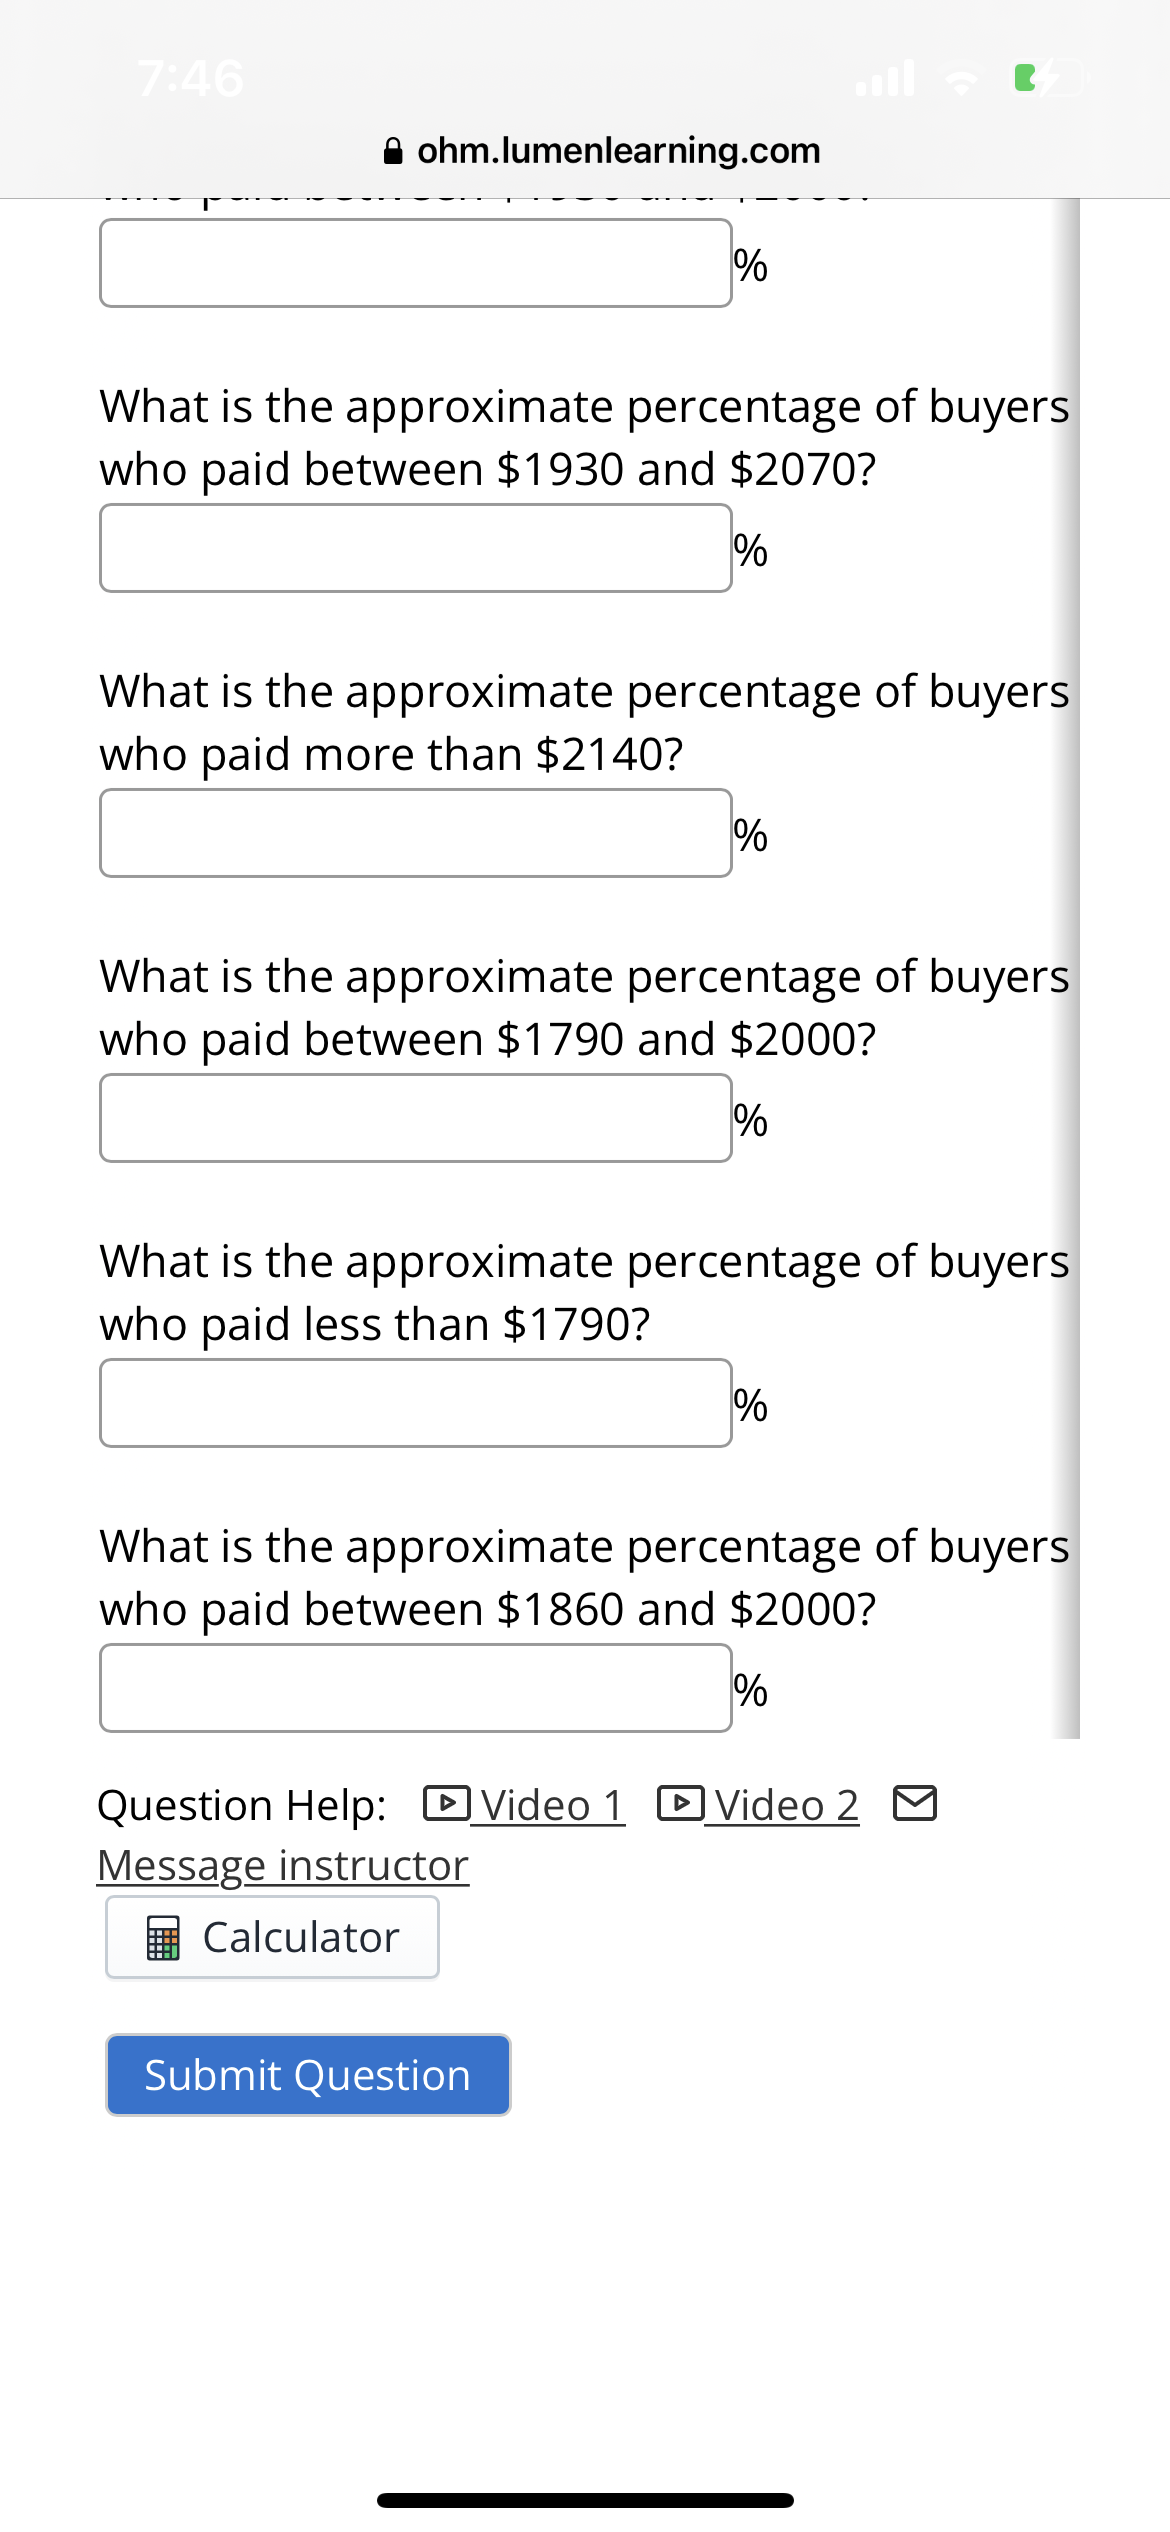
Transcribed Image Text:7:46
ohm.lumenlearning.com
What is the approximate percentage of buyers
who paid between $1930 and $2070?
%
%
What is the approximate percentage of buyers
who paid more than $2140?
What is the approximate percentage of buyers
who paid between $1790 and $2000?
%
%
What is the approximate percentage of buyers
who paid less than $1790?
Calculator
What is the approximate percentage of buyers
who paid between $1860 and $2000?
%
Submit Question
%
Question Help: Video 1 Video 2
Message instructor
Expert Solution
This question has been solved!
Explore an expertly crafted, step-by-step solution for a thorough understanding of key concepts.

This is a popular solution!

Trending now
This is a popular solution!

Step by step
Solved in 3 steps with 1 images

Recommended textbooks for you
Glencoe Algebra 1, Student Edition, 9780079039897…
Algebra
ISBN:
9780079039897
Author:
Carter
Publisher:
McGraw Hill
Glencoe Algebra 1, Student Edition, 9780079039897…
Algebra
ISBN:
9780079039897
Author:
Carter
Publisher:
McGraw Hill