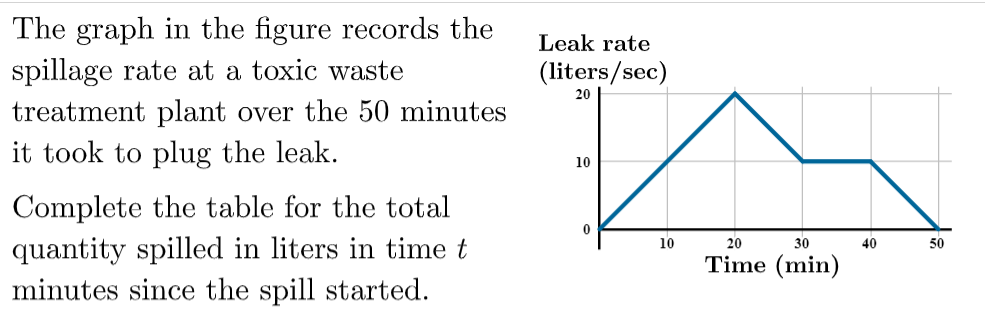
The graph in the figure records the spillage rate at a toxic waste treatment plant over the 50 minutes it took to plug the leak. Leak rate (liters/sec) 20 10 Complete the table for the total quantity spilled in liters in time t 10 20 30 40 50 Time (min) minutes since the spill started.
The graph in the figure records the spillage rate at a toxic waste treatment plant over the 50 minutes it took to plug the leak. Leak rate (liters/sec) 20 10 Complete the table for the total quantity spilled in liters in time t 10 20 30 40 50 Time (min) minutes since the spill started.

University Physics Volume 1
18th Edition
ISBN:9781938168277
Author:William Moebs, Samuel J. Ling, Jeff Sanny
Publisher:William Moebs, Samuel J. Ling, Jeff Sanny
Chapter1: Units And Measurement
Section: Chapter Questions
Problem 56P: Estimates and Fermi Calculations Assuming the human body is made primarily of water, estimate the...

Related questions

Question
I got 10 = 6, 20 =24 , 30 =18, 40 = 24, and 50 = 0 but they were wromg answers. Plese hlep
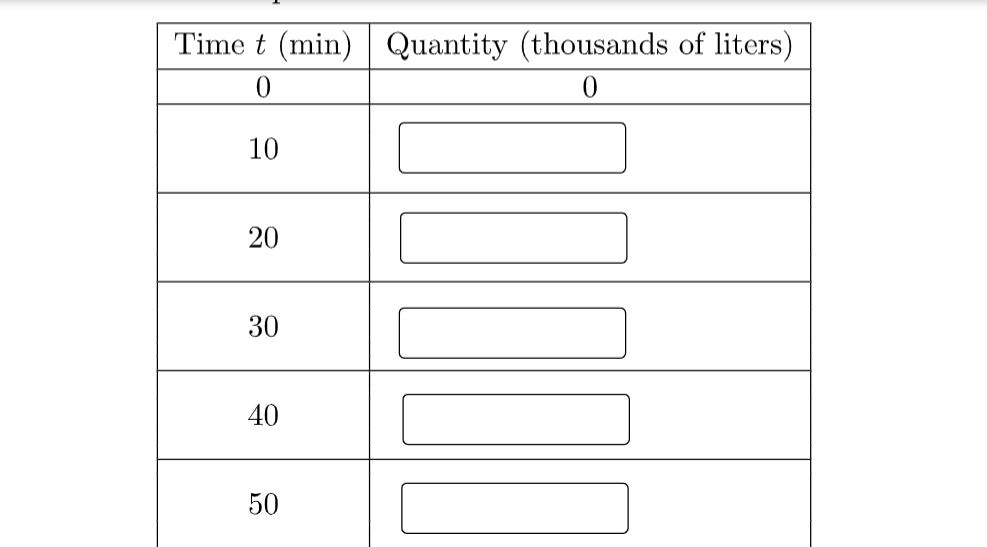
Transcribed Image Text:Time t (min) Quantity (thousands of liters)
10
20
30
40
50
Transcribed Image Text:The graph in the figure records the
spillage rate at a toxic waste
treatment plant over the 50 minutes
it took to plug the leak.
Leak rate
(liters/sec)
20
10
Complete the table for the total
quantity spilled in liters in time
minutes since the spill started.
10
20
30
40
50
Time (min)
Expert Solution
This question has been solved!
Explore an expertly crafted, step-by-step solution for a thorough understanding of key concepts.

This is a popular solution!

Trending now
This is a popular solution!

Step by step
Solved in 6 steps

Knowledge Booster


Learn more about
Need a deep-dive on the concept behind this application? Look no further. Learn more about this topic, physics and related others by exploring similar questions and additional content below.Recommended textbooks for you
University Physics Volume 1
Physics
ISBN:
9781938168277
Author:
William Moebs, Samuel J. Ling, Jeff Sanny
Publisher:
OpenStax - Rice University
University Physics Volume 1
Physics
ISBN:
9781938168277
Author:
William Moebs, Samuel J. Ling, Jeff Sanny
Publisher:
OpenStax - Rice University